Troubleshooting Deploys and Refreshes
You can view the results of a deploy or refresh three ways:
- Activity Feed
- API
- CLI
Deploy and Refresh Status
After a deploy or refresh, you'll be able to see which nodes were run and their status.
| Status | Description |
|---|---|
| Successful | The node finished executing all stages successfully. |
| Waiting | The node is waiting to run. |
| Queued | The node is part of the current run and is waiting execution. |
| Running | The node is currently running and stages may have already been completed. |
| Failed | The node has finished running and encountered an error. Some stages might have completed successfully. |
| Skipped | A step was skipped. Some stages might have completed successfully. |
| Canceled | The run was canceled while running. Some stages might have completed successfully. |
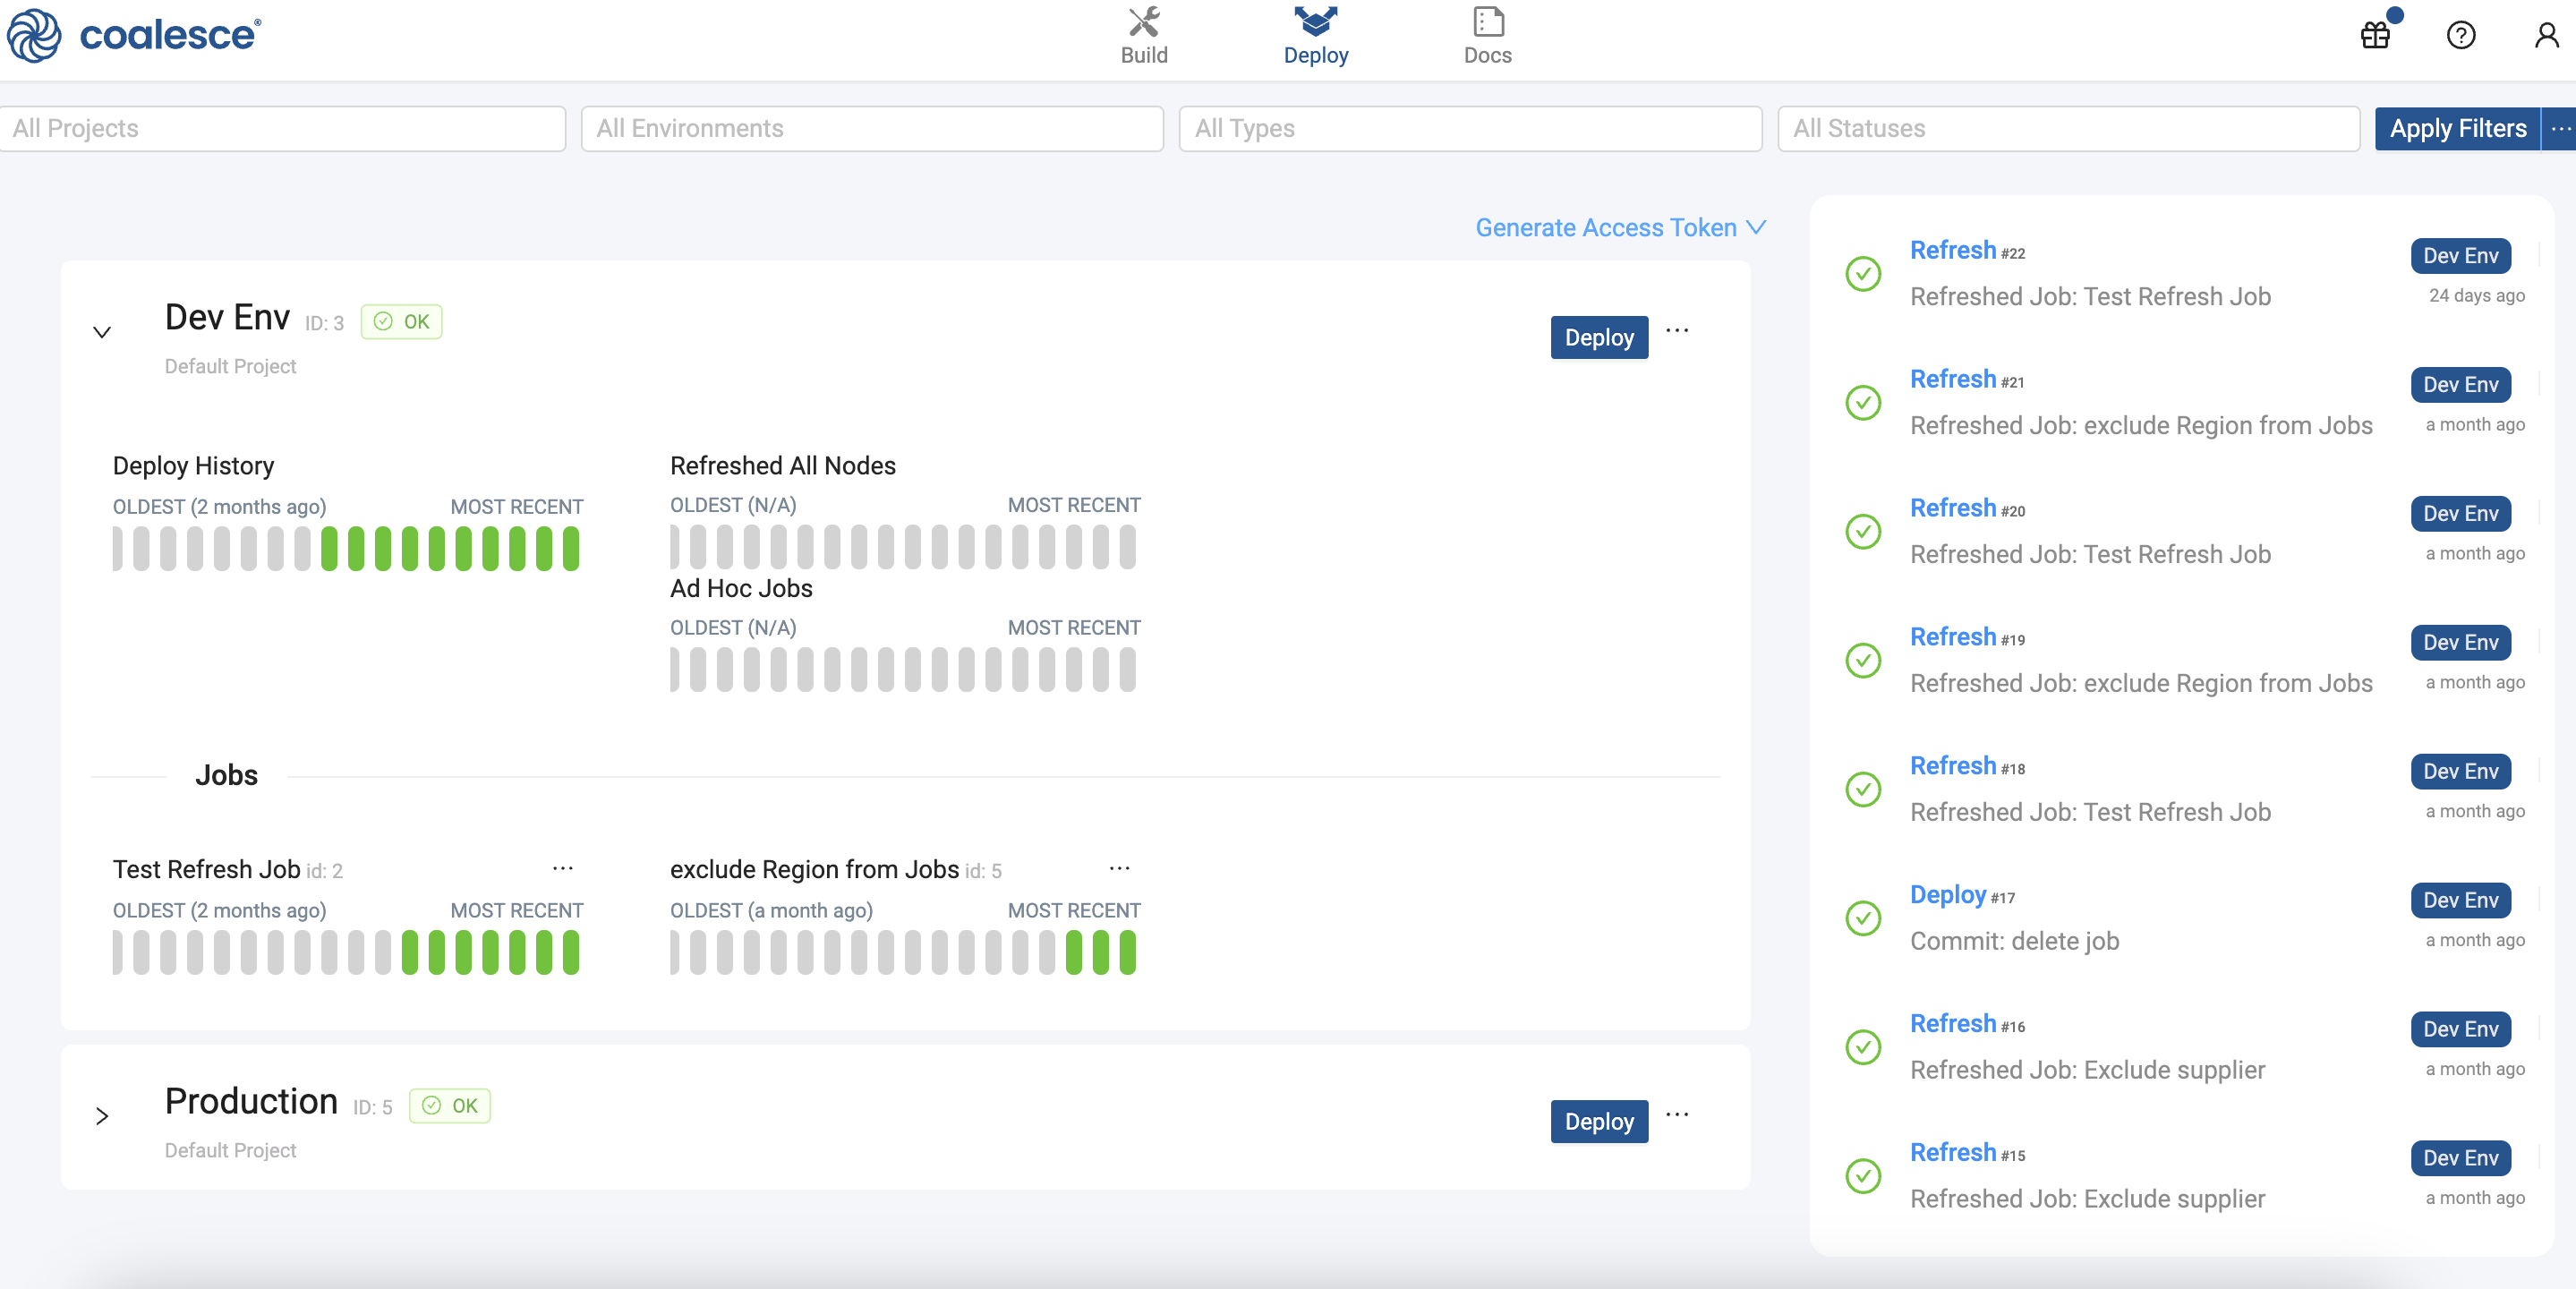
Activity Feed
In the Deploy Interface you check the status of current or completed runs.
The feed includes:
- Connection details
- Parameters used
- Details for each Node + steps for a Node
- Snowflake query ID
- Error messages
In this example, you'll review a failed deployment, but this can also be applied to Refresh and Jobs.
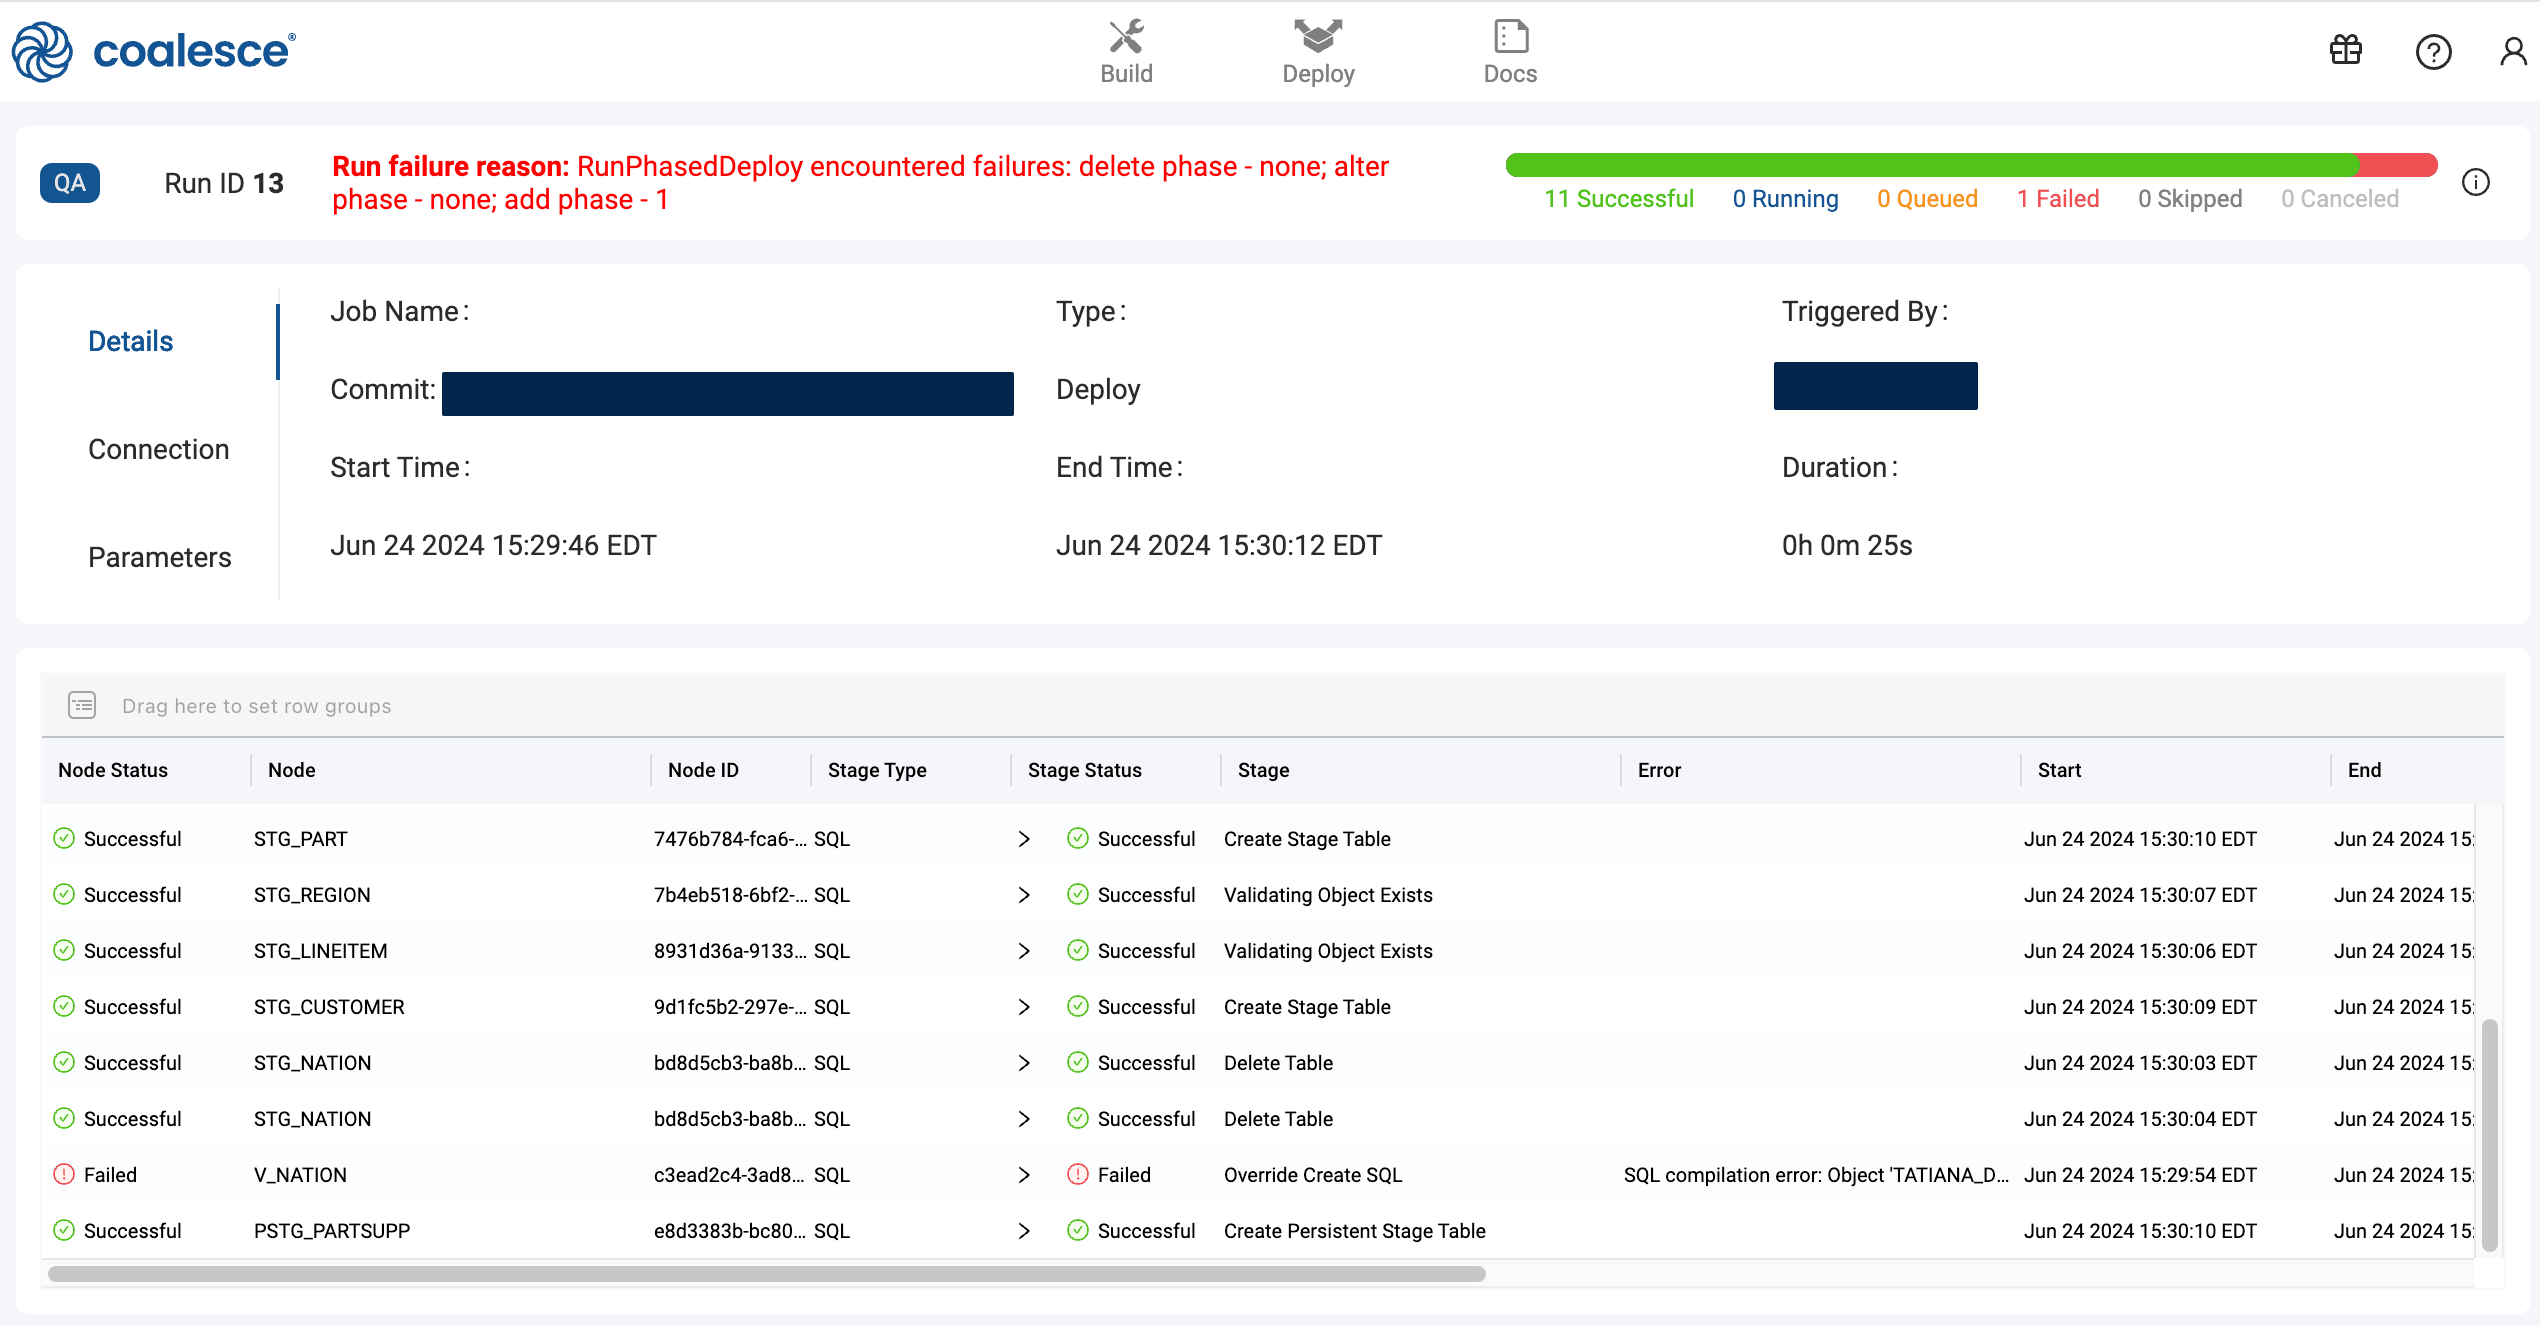
The heading contains:
- The phase and number of nodes that failed in that phase. In this example it's one node in the add phase.
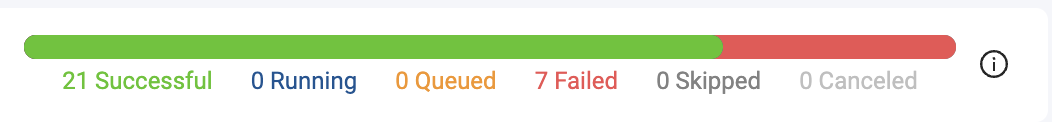
Run failure reason: RunPhasedDeploy encountered failures: delete phase - none; alter phase - none; add phase - 1 - The status and number of nodes. In this example, 11 were successful and one failed.
The row contains:
- The failed node. The failed node in this example is,
V_Nation.
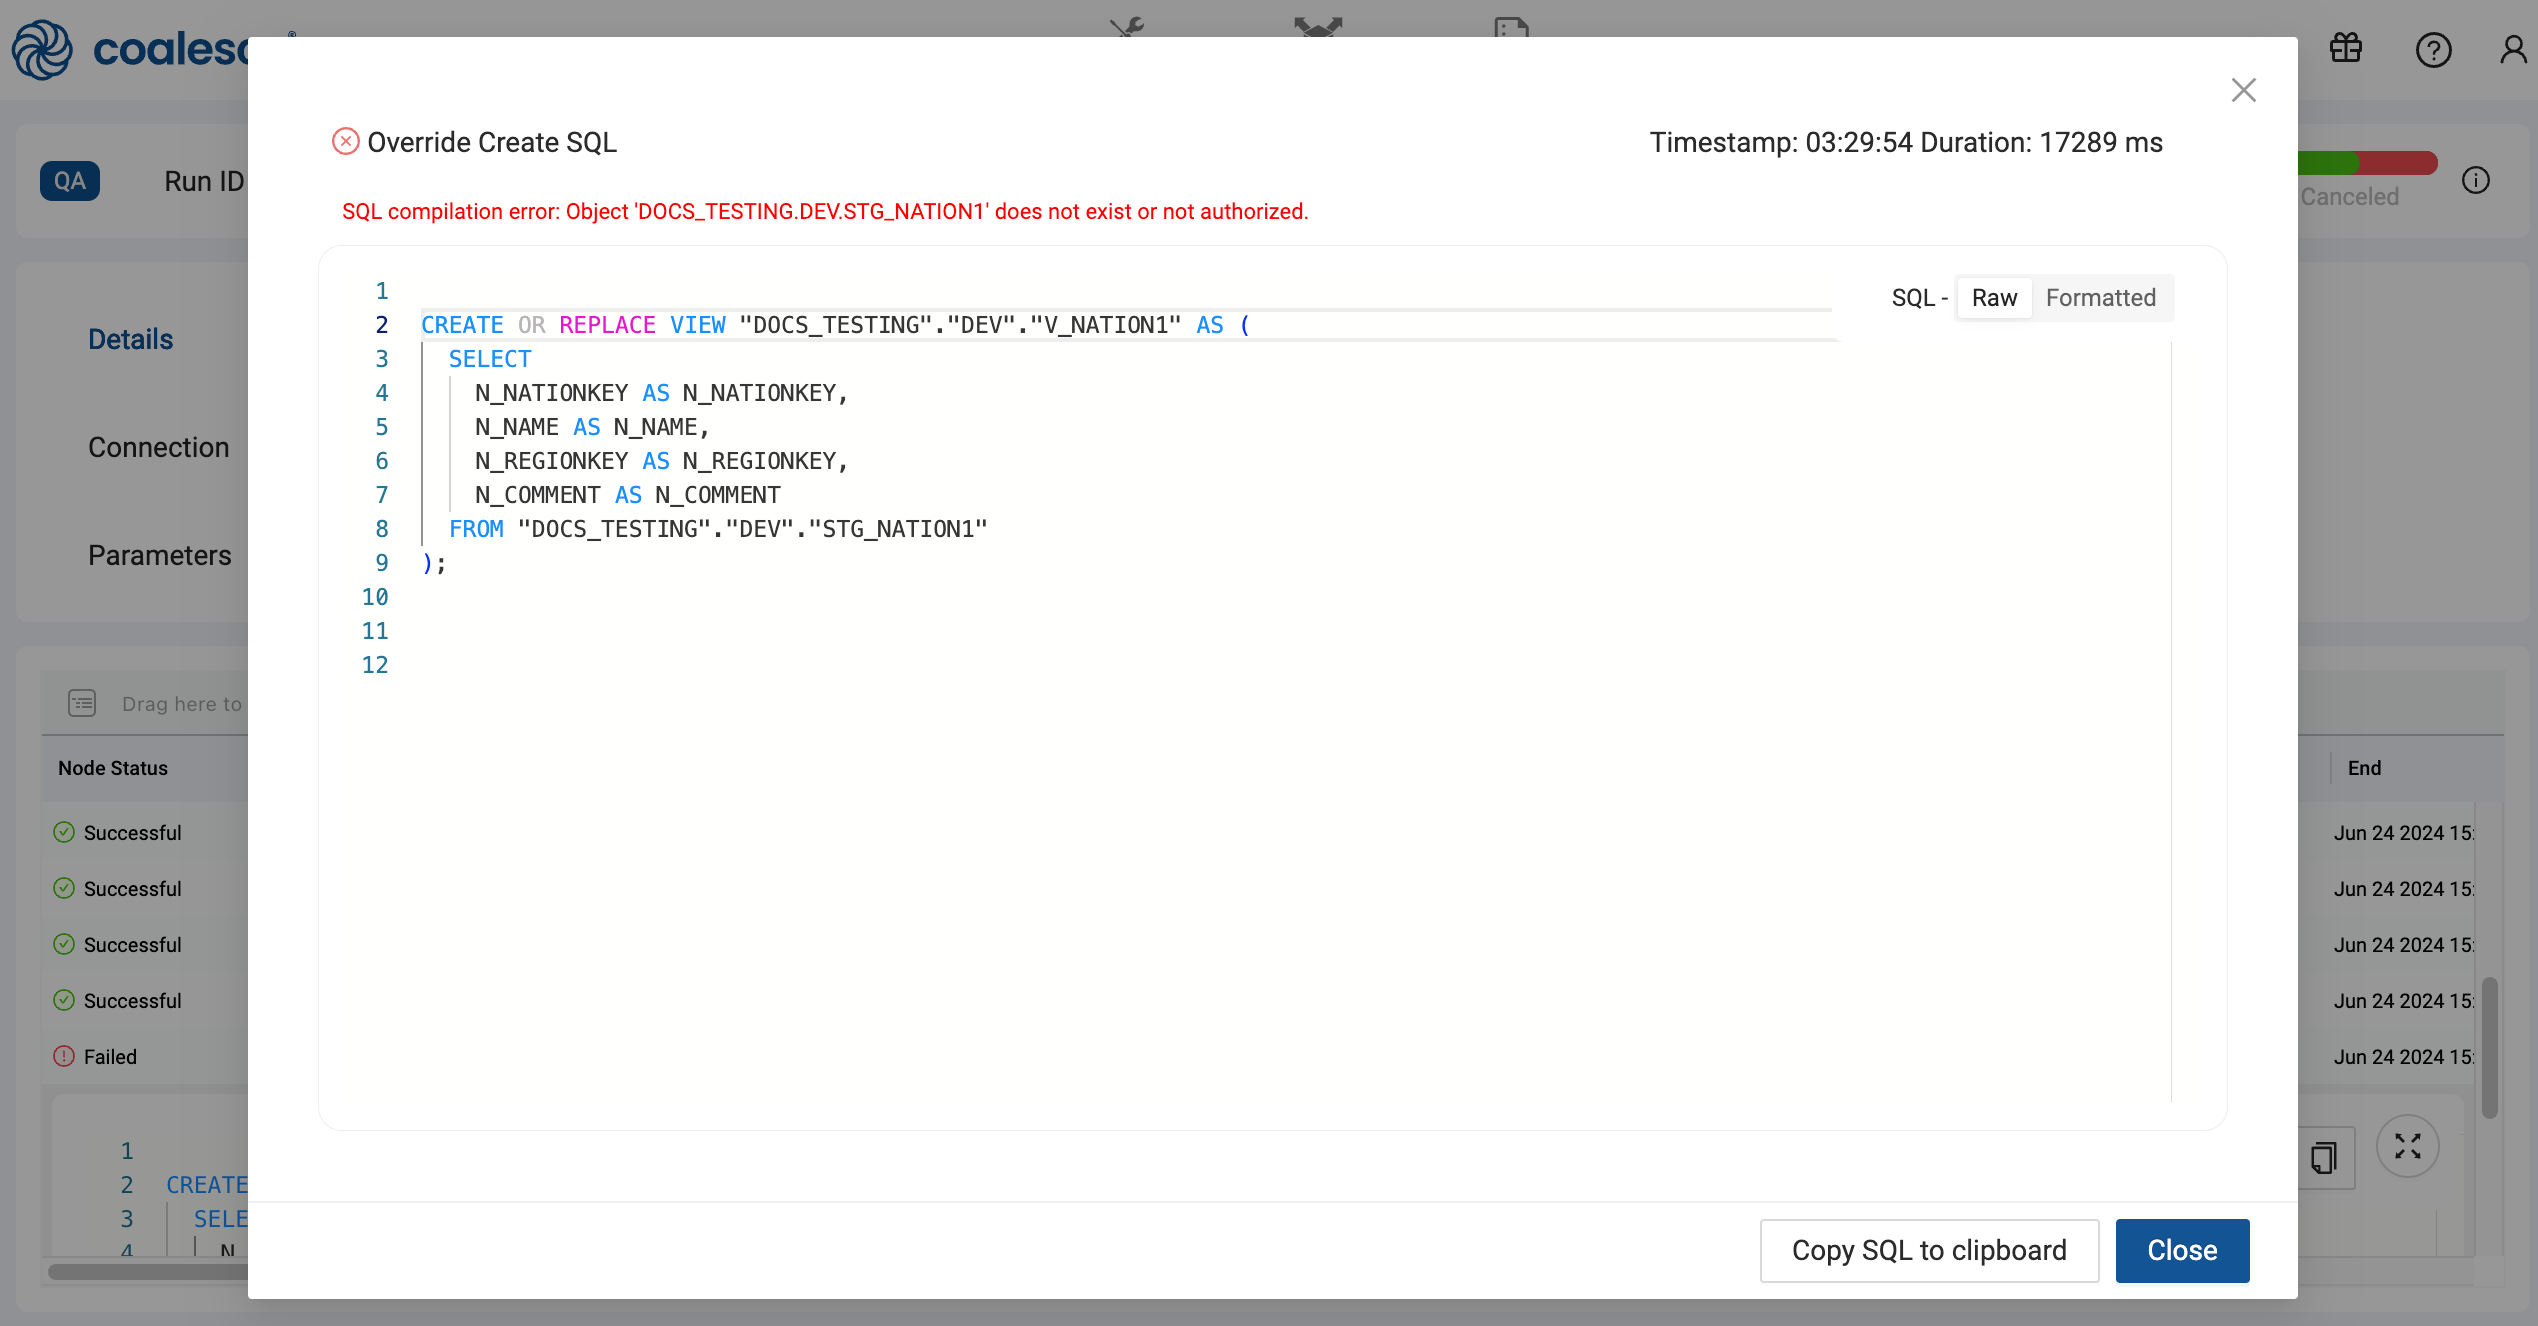
Double clicking on the error will open a new window that includes the error message and the SQL for that stage.
The error for this run is SQL compilation error: Object 'DOCS_TESTING.DEV.STG_NATION1' does not exist or not authorized.
Once the error is resolved, you can run the Job from the point of failure, rollback your deployment, or update your pipeline and redeploy.
Using the API
Use the List Run Results API to get the results of a deploy or refresh.
In this example, you'll review a failed deployment, but this can also be applied to Refresh and Jobs.
    {
      "nodeID": "97378833-0000-46bc-9582-e68ded3ae016",
      "runState": "error",
      "isRunning": false,
      "name": "STG_ORDERS",
      "queryResults": [
        {
          "endTime": "2024-07-16T15:13:19.357Z",
          "error": {
            "errorString": "SQL compilation error:\nDatabase 'DOCUMENTATION_SNOWFLAKE_TEST' does not exist or not authorized.",
            "errorDetail": "002003"
          },
          "isRunning": false,
          "name": "Delete Table",
          "queryID": "01b5b591-0905-106b-0012-7b030fac7362",
          "sql": "\n    DROP TABLE IF EXISTS \"DOCUMENTATION_SNOWFLAKE_TEST\".\"DEV\".\"STG_ORDERS_COALESCE_INTERNAL_TABLE\"",
          "startTime": "2024-07-16T15:13:10.641Z",
          "status": "Failure",
          "success": false
        }
      ]
    },
...
The response is organized by nodeID. The response will contain the current status, the node name, the name of the stage that was executed, and the error message if applicable. Review the full response example for all fields.
You can see "nodeID": "97378833-0000-46bc-9582-e68ded3ae016", failed because "SQL compilation error:\nDatabase 'DOCUMENTATION_SNOWFLAKE_TEST' does not exist or not authorized.". The database, it was trying to run the stage, "name": "Delete Table" from does not exist.
Once the error is resolved, you can run the Job from the point of failure, rollback your deployment, or update your pipeline and redeploy.
CLI
Use coa runs to get the deployment status.
When deploying or refreshing using the CLI, add the --out flag to return in depth results as JSON. For example, coa deploy --out debug.json.
In this example, you'll review a failed deployment, but this can also be applied to Refresh and Jobs.
....
|2024-07-18T17:00:45.155Z|[RENDERER]()|)|info:Pyodide initialization complete in  1.3305933750000003  seconds
|2024-07-18T17:00:45.159Z|[RENDERER]()|)|info:Pyodide initialization complete in  1.3246505830000004  seconds
|2024-07-18T17:00:45.198Z|[RENDERER]()|)|info:Pyodide initialization complete in  1.363098707999999  seconds
|2024-07-18T17:00:55.135Z|[CLI]|(org:alRPfzuHZouUUN0Zupc9)|(env:2)|(user:Owb7B45m0UNSL4OumkDNpcFifTA3)|run:28)()|)|error:An error occurred during Deployment: {
  error: {
    errorString: 'RunPhasedDeploy encountered failures: \n' +
      '        delete phase - 7; \n' +
      '        alter phase - none; \n' +
      '        add phase - 1\n' +
      '      ',
    errorDetail: 'RunPhasedDeploy encountered failures: \n' +
      '        delete phase - e3e488cc-232f-4e7f-a266-16fe8b4dfd79,e38d8549-bfd0-4044-80ef-108ab297b431,e1e2ea88-de6e-4930-8aaa-dd5ffd1851d9,a7ee70b6-d2a3-4a59-acea-f5a0951b6981,97378833-0000-46bc-9582-e68ded3ae016,3a85b97f-6e6e-4d26-8986-8161f1dd378c,7771b0de-037f-4d9a-a1ad-22400fc0414b; \n' +
      '        alter phase - none; \n' +
      '        add phase - bde6322a-45d0-4964-9606-6a0d0a9867d5\n' +
      '      '
  }
}
When a deploy finished it will return a status in the command line.
The errorString will tell you which nodes failed in each phase.
- The delete phase has 7 nodes encounter errors.
- The alter phase had no errors.
- The add phase had 1 node encounter errors.
The errorDetail will return a list of node IDs that failed for each phase.
Using JSON Output
By adding --out to return the results as JSON, you can get a detailed error message. Here you can see the error details: SQL compilation error:\nObject 'DOCUMENTATION_DOCS_TESTING.DEV.STG_LINEITEM' does not exist or not authorized."
{
  "runResults": {
    "runStartTime": {
      "seconds": 1721322042,
      "nanoseconds": 300000000
    },
    "runEndTime": {
      "seconds": 1721322054,
      "nanoseconds": 238000000
    },
    "runType": "deploy",
    "runStatus": "failed",
    "runID": 28,
    "runResults": [
      {
        "nodeID": "bde6322a-45d0-4964-9606-6a0d0a9867d5",
        "queryResultSequence": {
          "isRunning": false,
          "name": "STG_LINEITEM",
          "queryResults": [
            {
              "exportedRefs": [],
              "sql": "\nSELECT 1 FROM \"DOCUMENTATION_DOCS_TESTING\".\"DEV\".\"STG_LINEITEM\" LIMIT 0",
              "renderEndTime": {
                "seconds": 1721322044,
                "nanoseconds": 129000000
              },
              "type": "sql",
              "fields": [],
              "startTime": {
                "seconds": 1721322043,
                "nanoseconds": 719000000
              },
              "success": false,
              "error": {
                "errorDetail": "002003",
                "errorString": "SQL compilation error:\nObject 'DOCUMENTATION_DOCS_TESTING.DEV.STG_LINEITEM' does not exist or not authorized."
              },
              "rows": [],
              "stageExecutionStartTime": {
                "seconds": 1721322051,
                "nanoseconds": 791000000
              },
              "invalidExportedRefs": [],
              "warehouse": null,
              "queryID": "01b5c13c-0905-144e-0012-7b030fbc081a",
              "isRunning": false,
              "renderStartTime": {
                "seconds": 1721322043,
                "nanoseconds": 719000000
              },
              "stageExecutionEndTime": {
                "seconds": 1721322053,
                "nanoseconds": 565000000
              },
              "endTime": {
                "seconds": 1721322053,
                "nanoseconds": 565000000
              },
              "name": "Validating Source Exists",
              "status": "Failure"
            }
          ]
        },
        "runState": "error"
      },
Once the error is resolved, you can run the Job from the point of failure, rollback your deployment, or update your pipeline and redeploy.
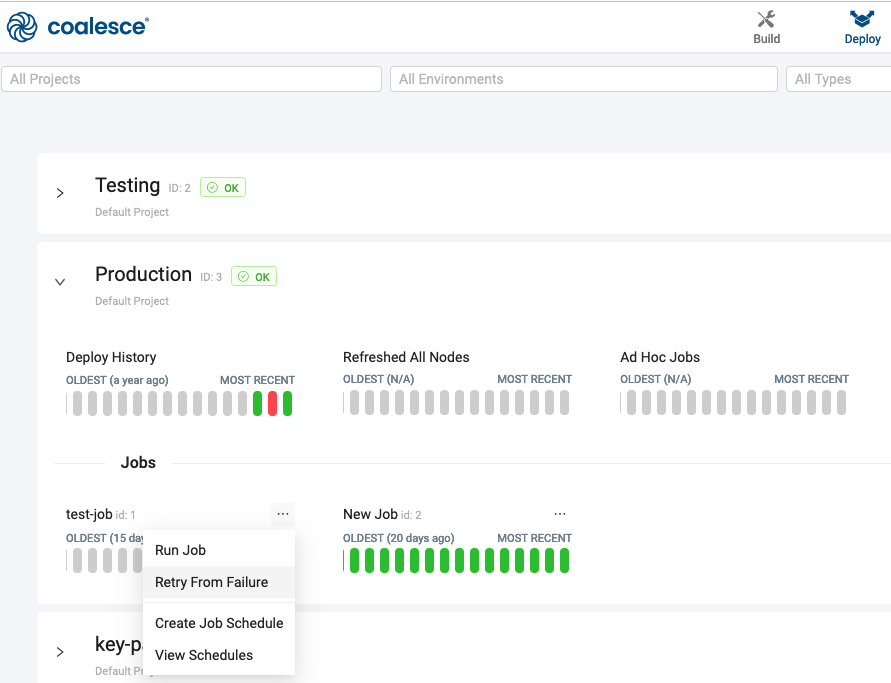
Retry From Failure
If a Job failed you can retry the Job from the point of failure. You can use the:
- API - Use the Rerun a Job endpoint.
- Coalesce App - You can select the Job that failed and click Retry From Failure.
- Scheduler - You can configure scheduled Jobs to retry from beginning or from the point of failure.
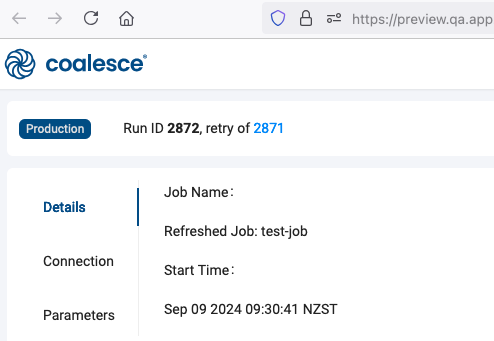
When you retry a Job from failure, in the Coalesce app, you'll be able to see the previous run details.
Rollback Your Deployment
You can redeploy the commit that was deployed just prior to the deployment you wish to rollback. Learn more in Rollback a Deployment.
Redeploy
You can edit your pipeline, commit the changes, and redeploy to fix any errors.