Documentation index: llms.txt. This page is also available as markdown: append .md to this URL or send Accept: text/markdown.
Pipeline Documentation
Documentation is an essential component of building a sustainable data architecture, but is sometimes put aside to focus on development work to meet deadlines. Coalesce automatically produces and updates documentation as developers work.
Accessing Generated Documentation
Generated documentation for a Workspace or Environment can be accessed in three different ways.
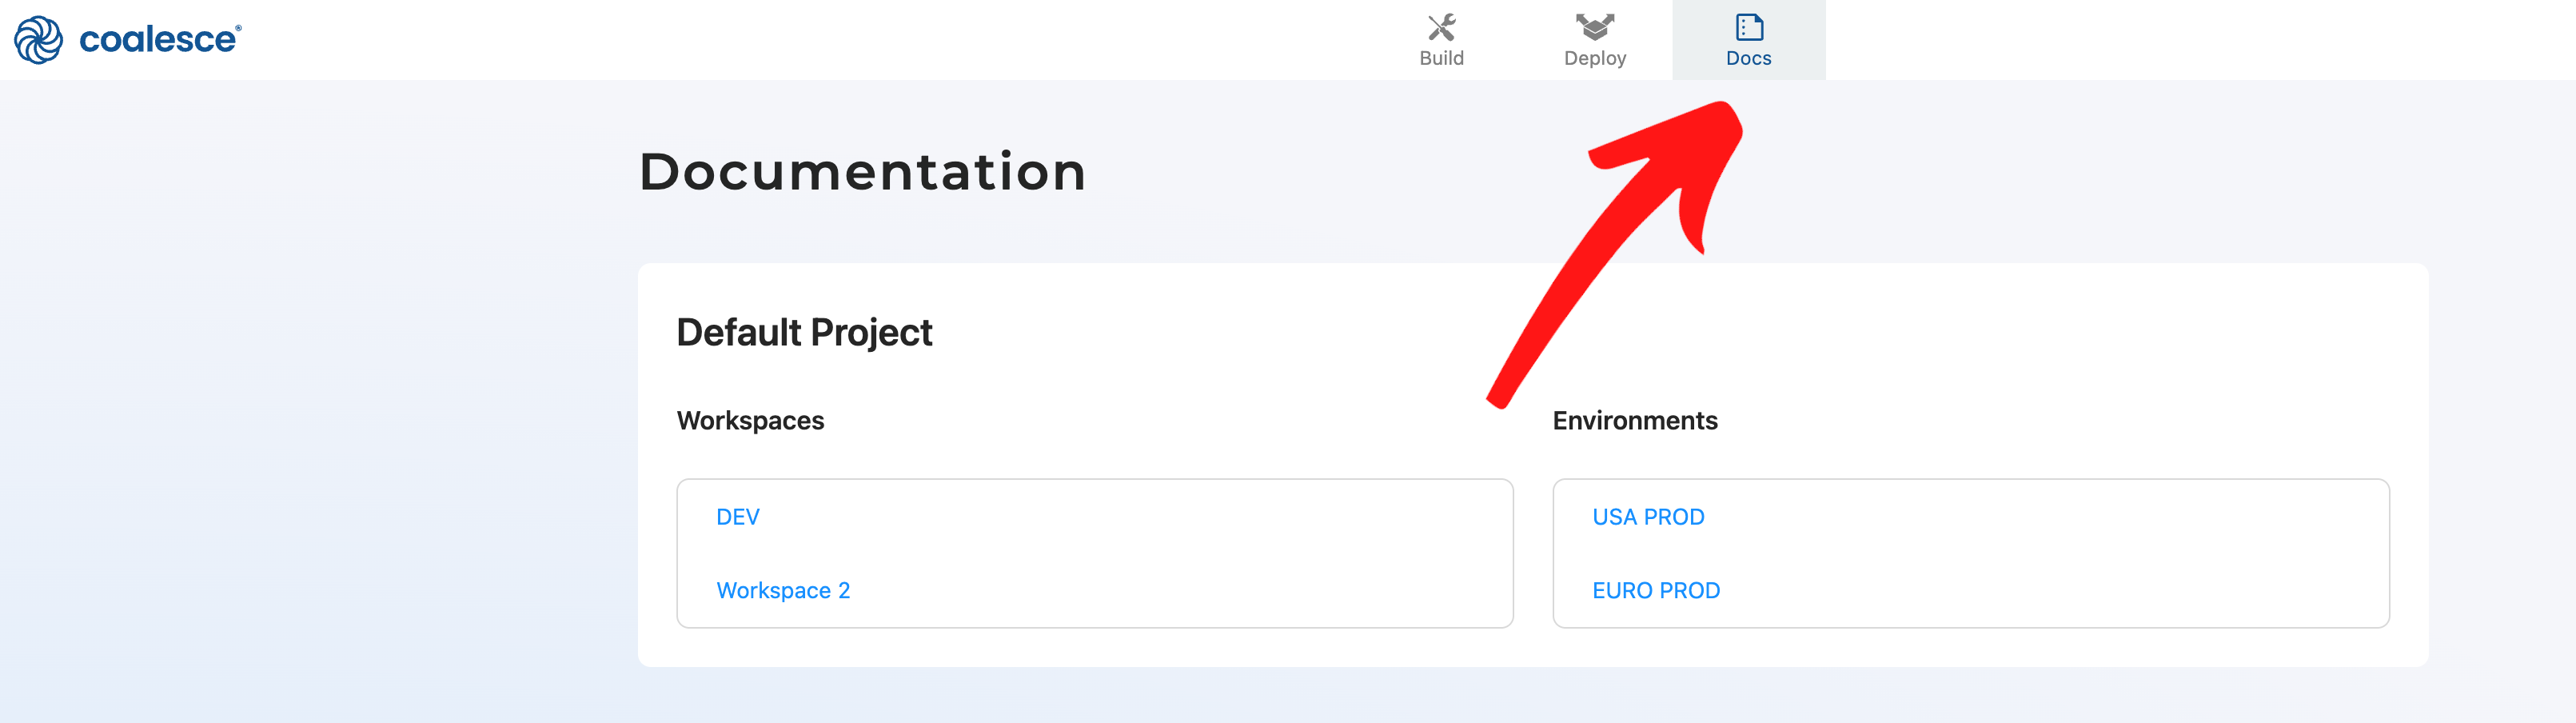
Workspace and Environments
Both Workspaces and Environments - From the top of the user interface, through the Docs link.
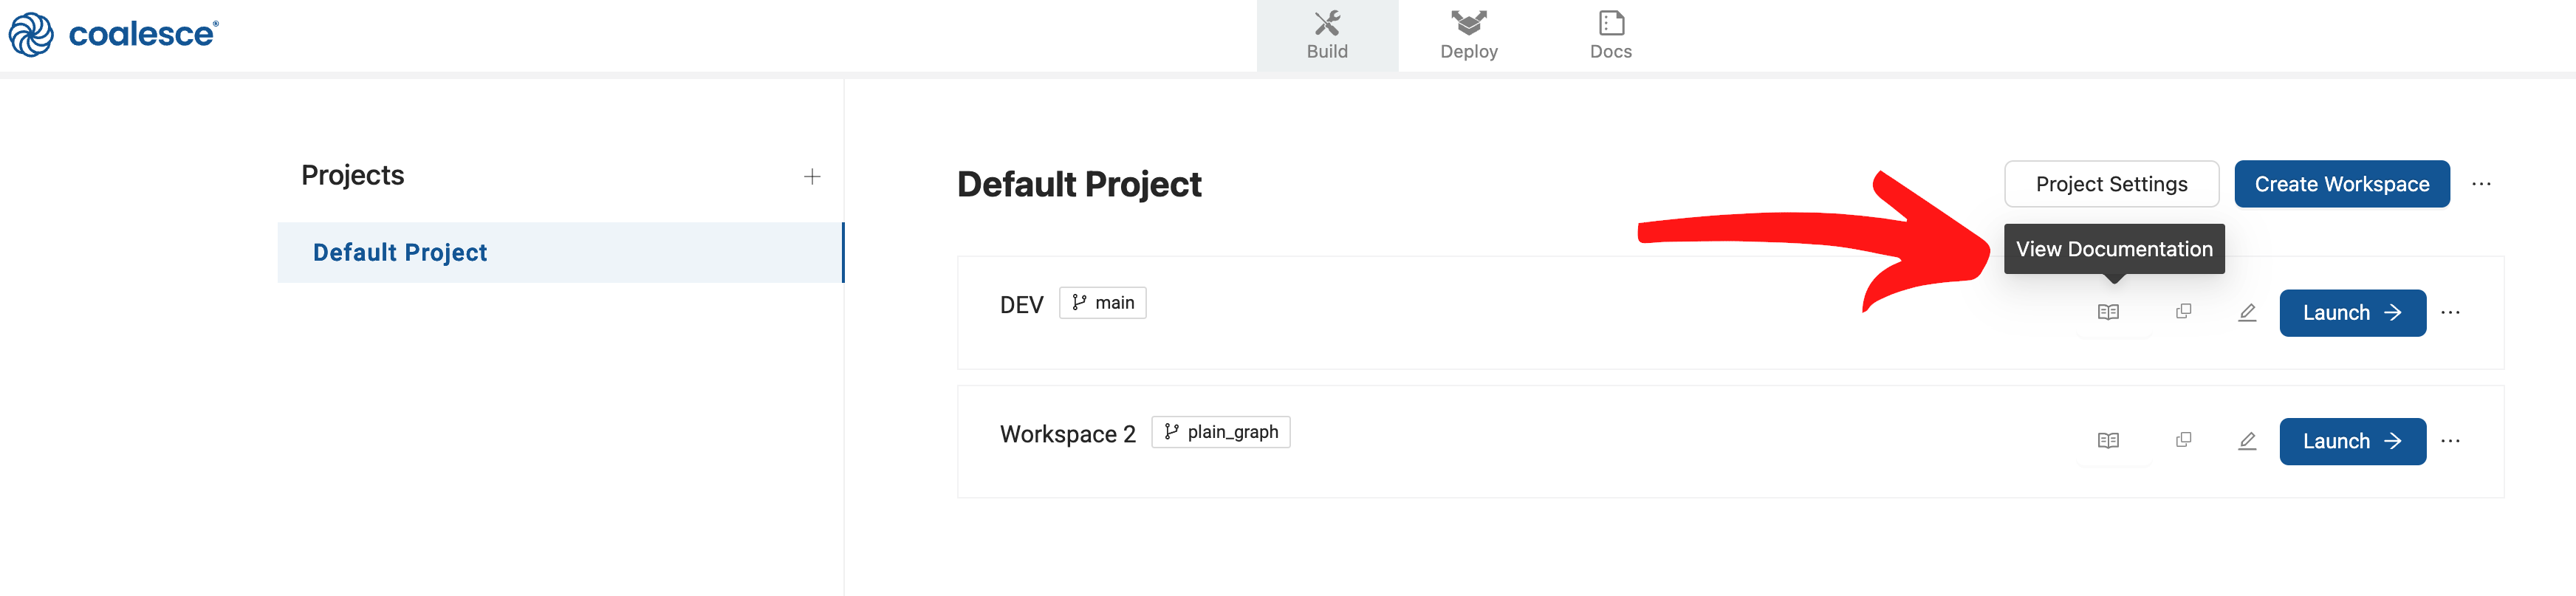
Workspaces
Only Workspaces - From the Projects Dashboard, through the Docs icon.
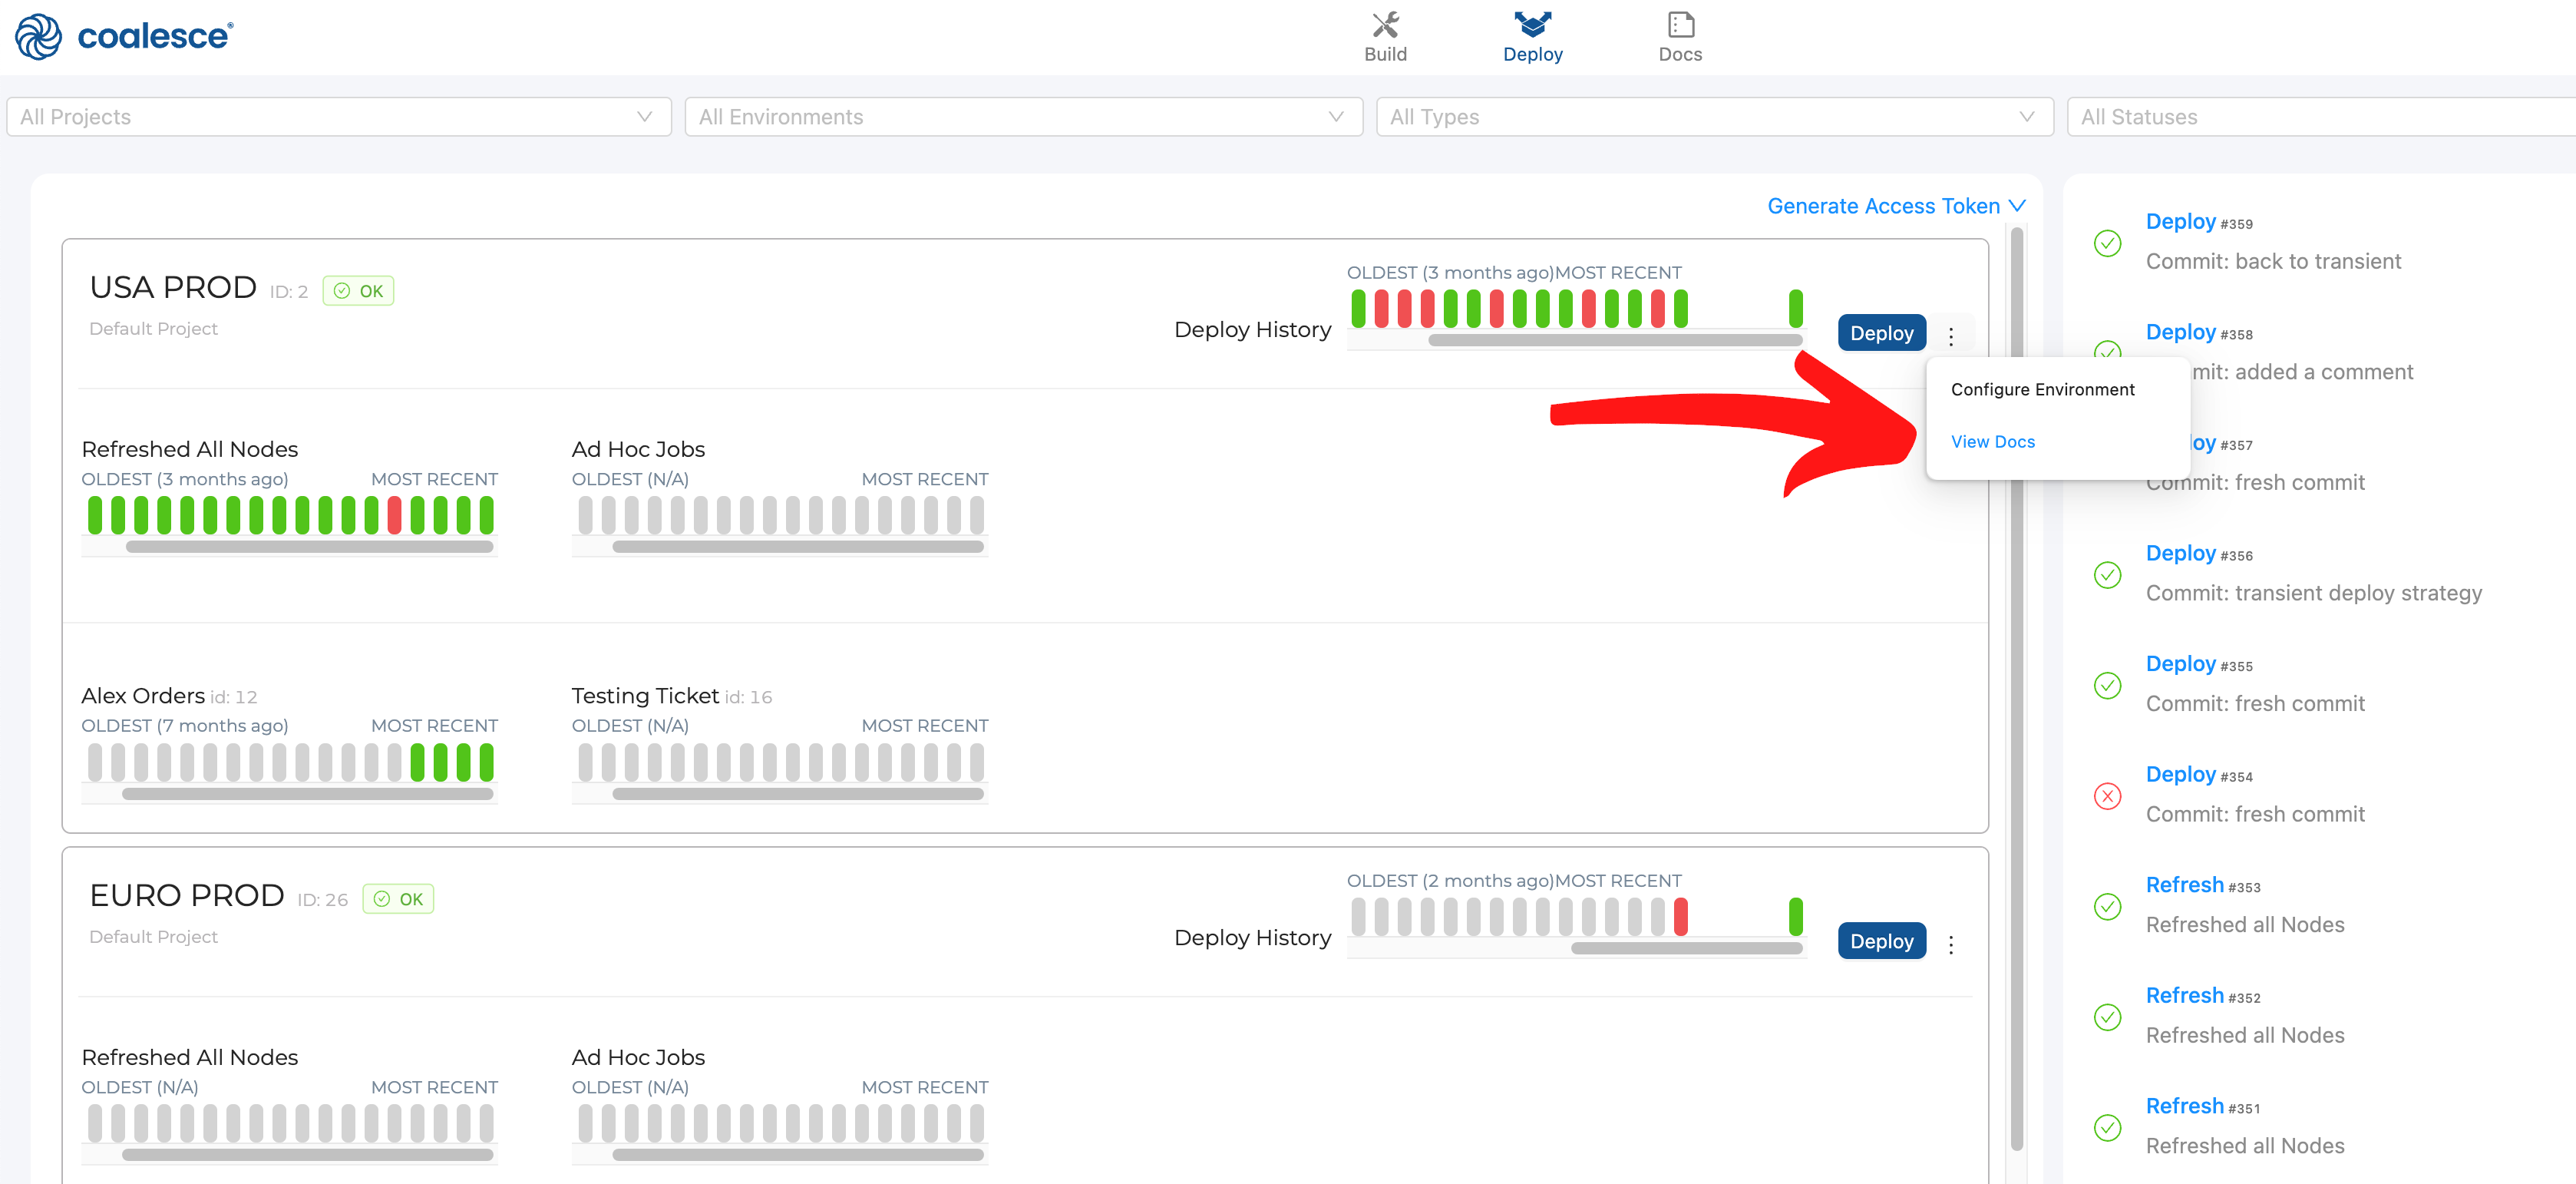
Environments
Only Environments - From the Deploy Dashboard click on the ellipses and then View Docs.
Interface Overview
The new documentation interface consists of three sections.
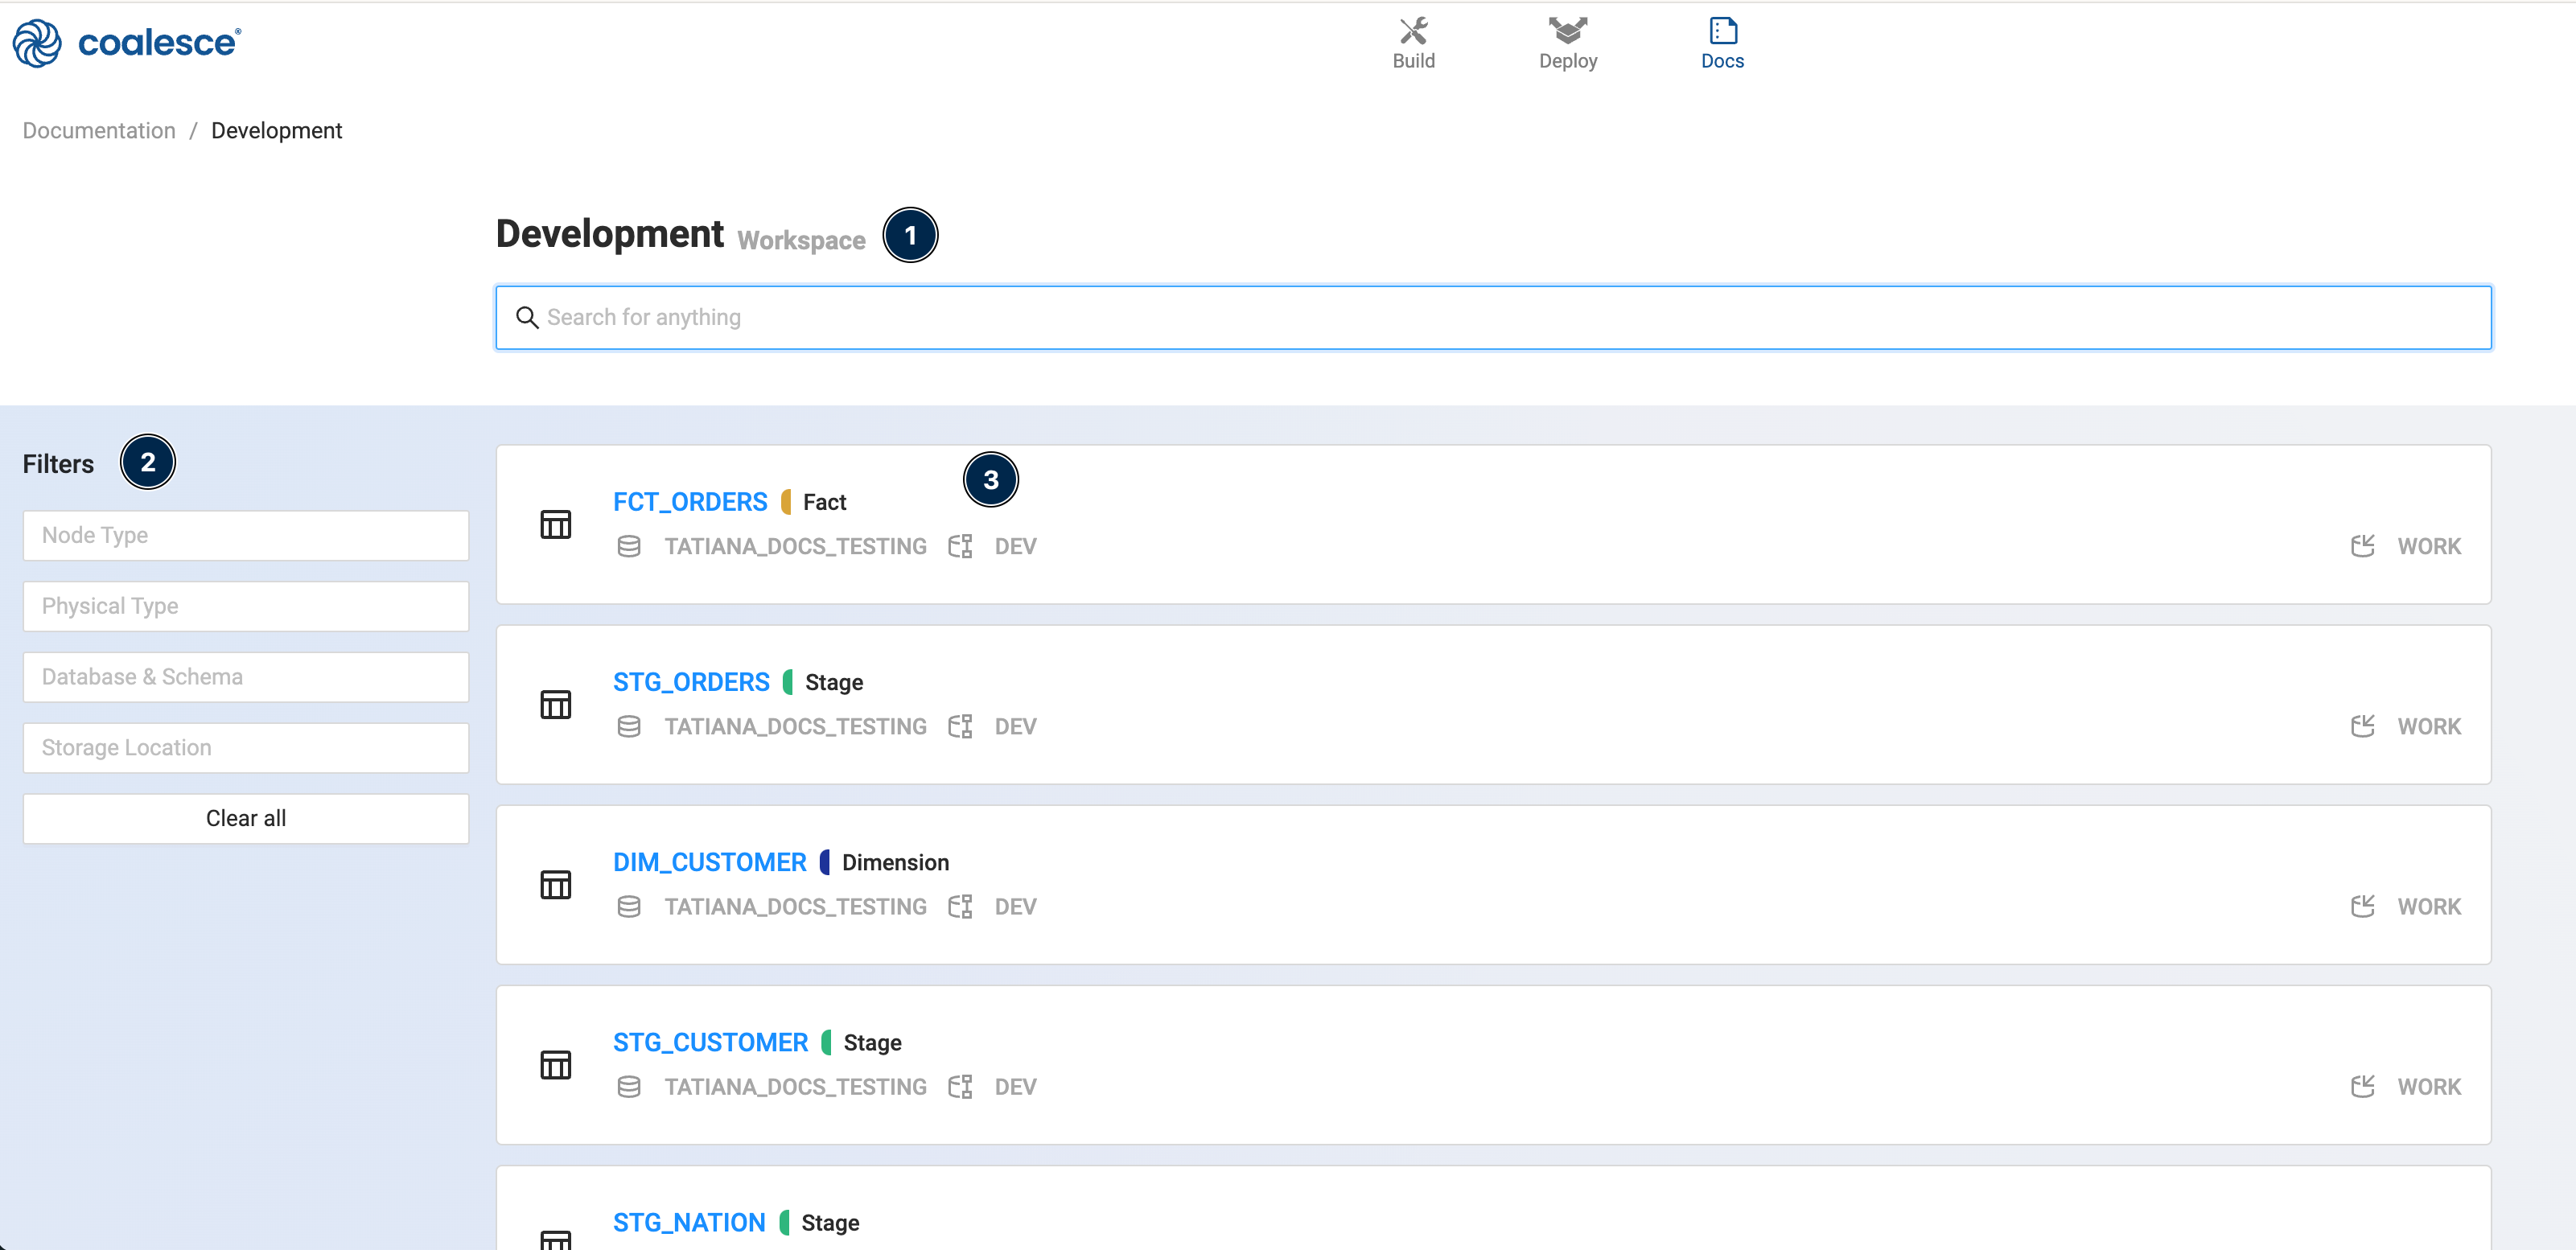
1. Search
Users can search for Node names, physical types, databases, schemas, and storage locations. Node names can be searched for using any portion of the Node's name, while all other objects are searched using a prefix search only. For example, if the storage location is PROD_RAW, searching for RAW will not yield any results. On the other hand, if a Node is named STG_CUSTOMER, searching for either STG or CUST will be effective.
2. Filters
The Filters dropdowns allow the user to limit the Nodes currently visible in the Results List. For example, if one wanted to see only Nodes of type Stage, then they would select Node type > Stage, and the Results List will be updated in real time.
3. Results List
This section will have the results, which come from a combination of search terms and filters used.
Sharing Results
Search terms and filters automatically adjust the URL, which makes results easy to share, as other users can use the same URL to access the same results.
Exporting Documentation
The Coalesce documentation can't be exported. The Command Line Interface and API can be used to programmatically gather information about your Coalesce organization, such as a list of your Environments with their details, Node contents, etc.
Documentation Walkthrough
You’ll learn more about Coalesces' documentation feature and how to navigate each page.
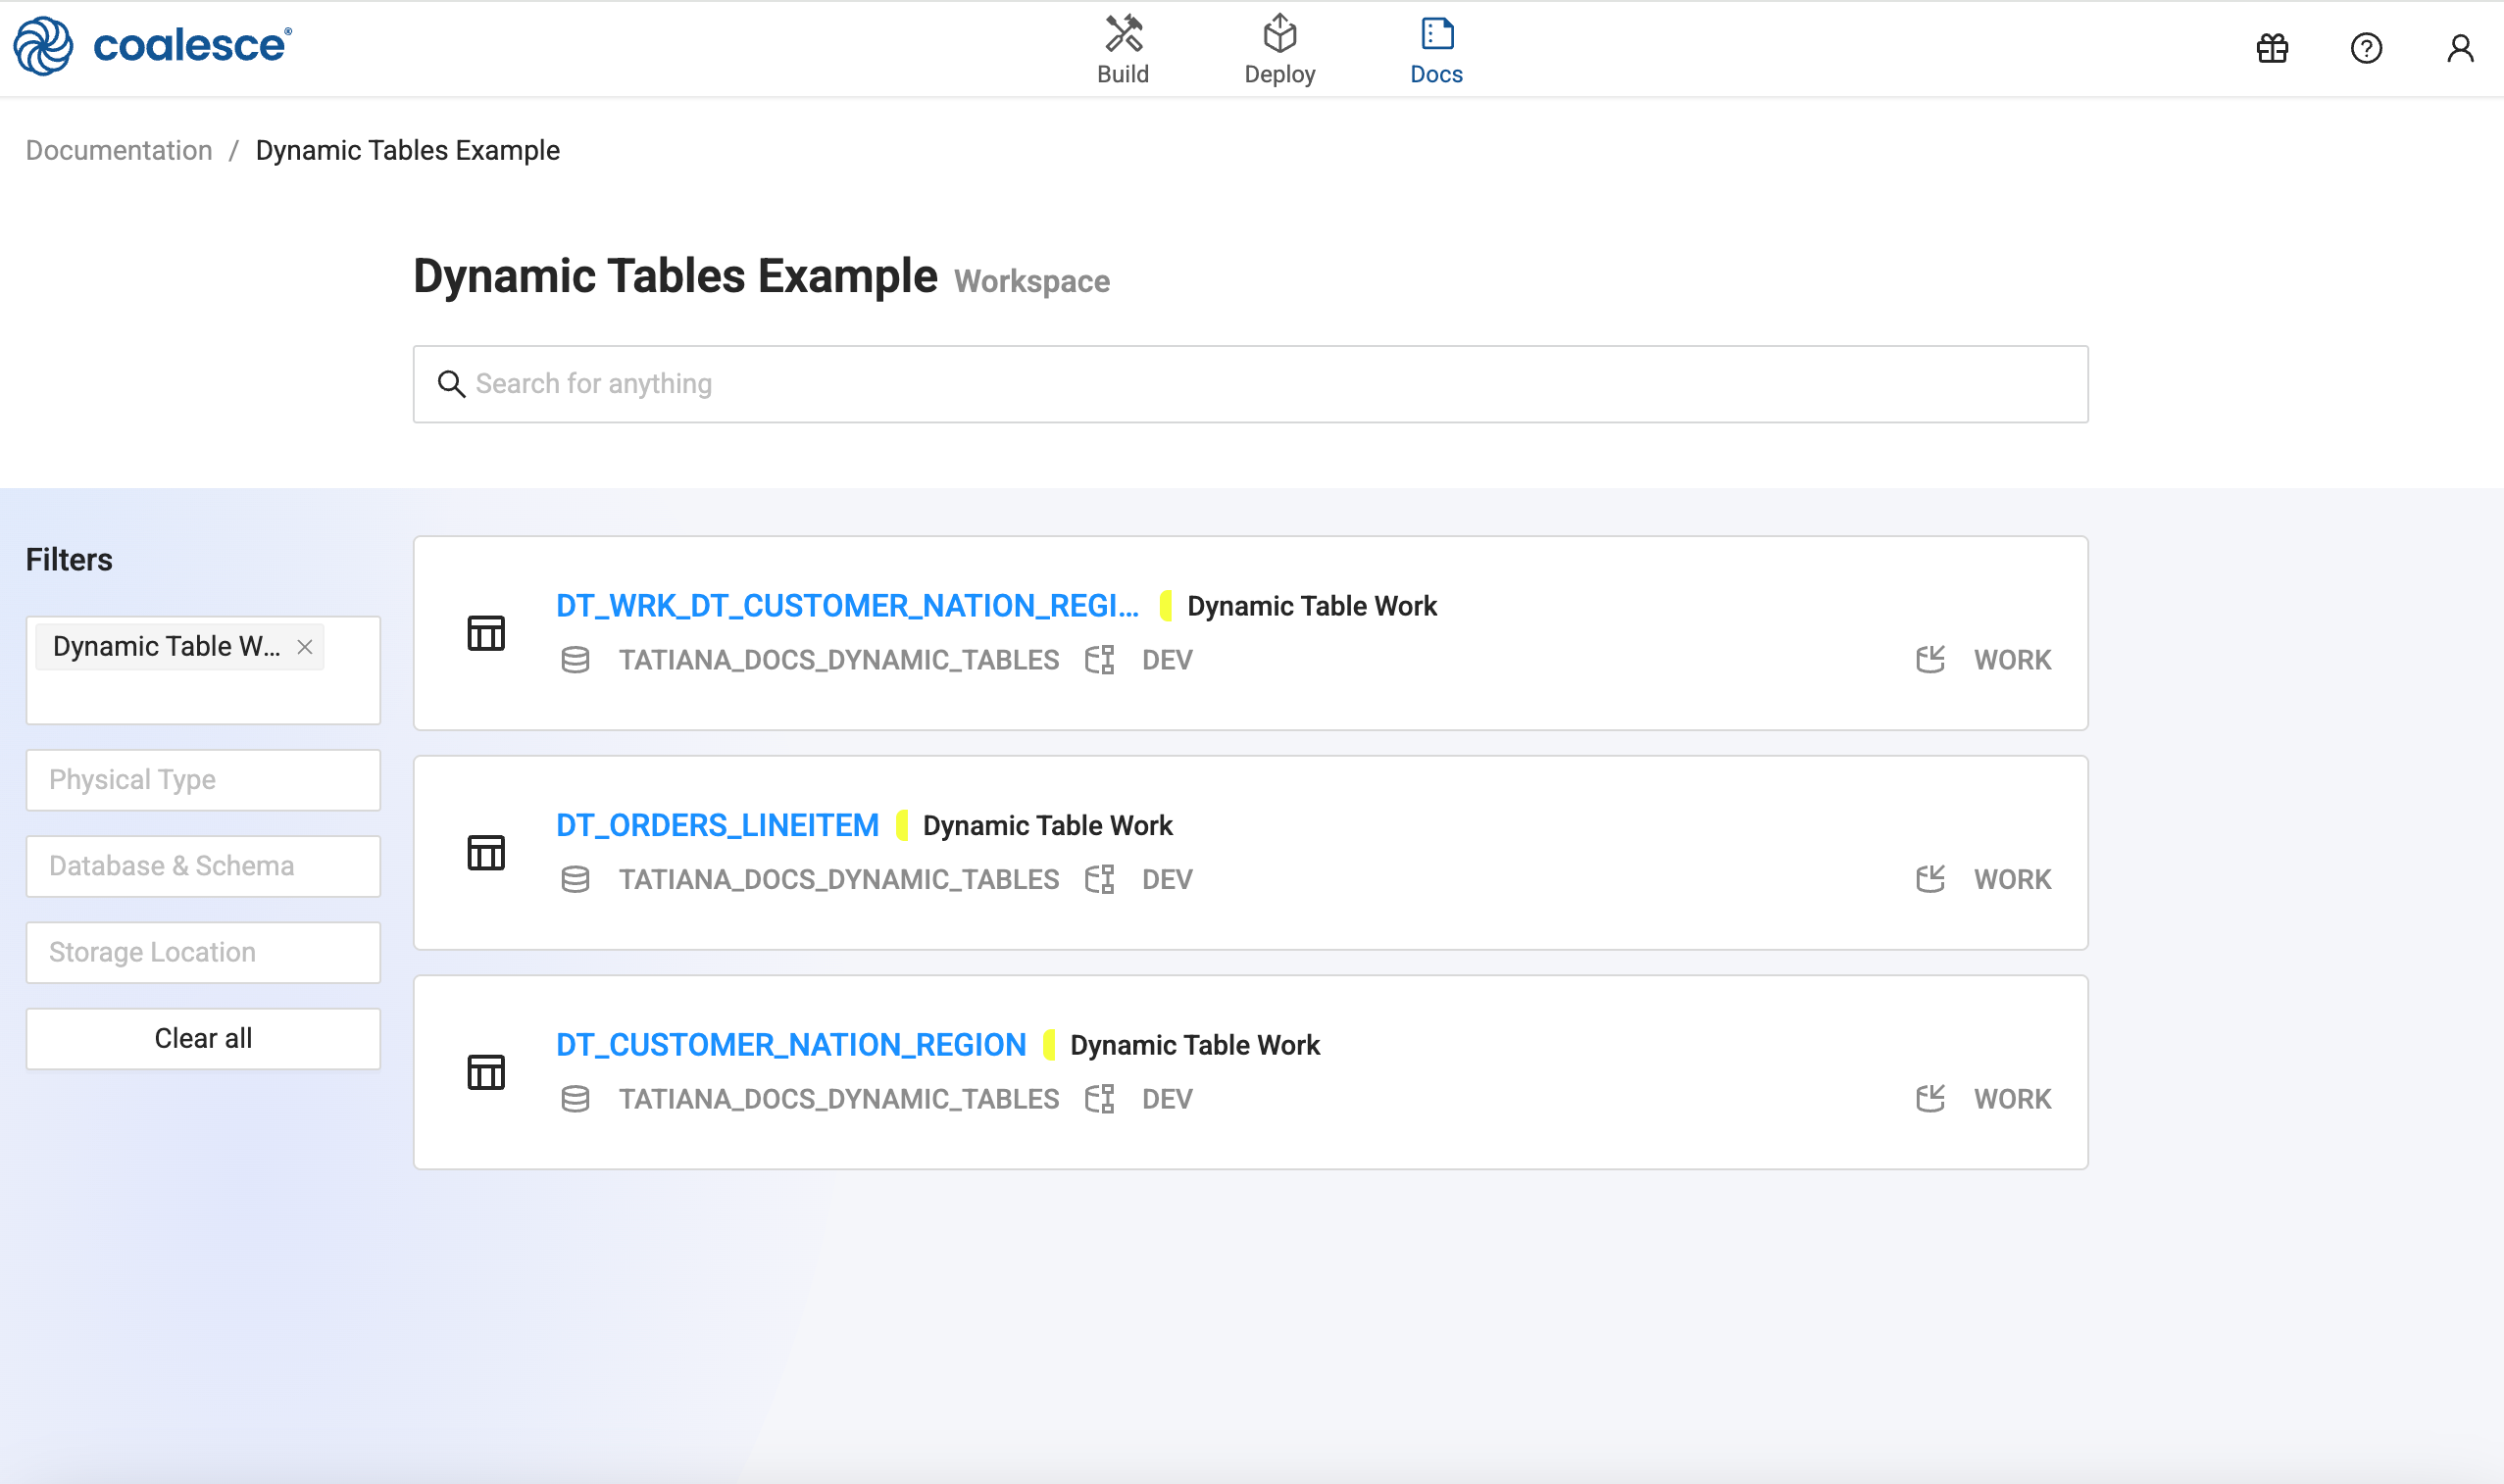
Nodes Landing Page
The landing page helps you filter and focus on the specific Nodes you wish to view. In this example, the filter for Dynamic Table Work was added and returns three Nodes of that type. Clicking on a Node name will take you to the documentation for that Node.
Node Information
This section provides navigation and column documentation for the Node. Expand each section by clicking the arrows, or use the breadcrumbs to navigate.
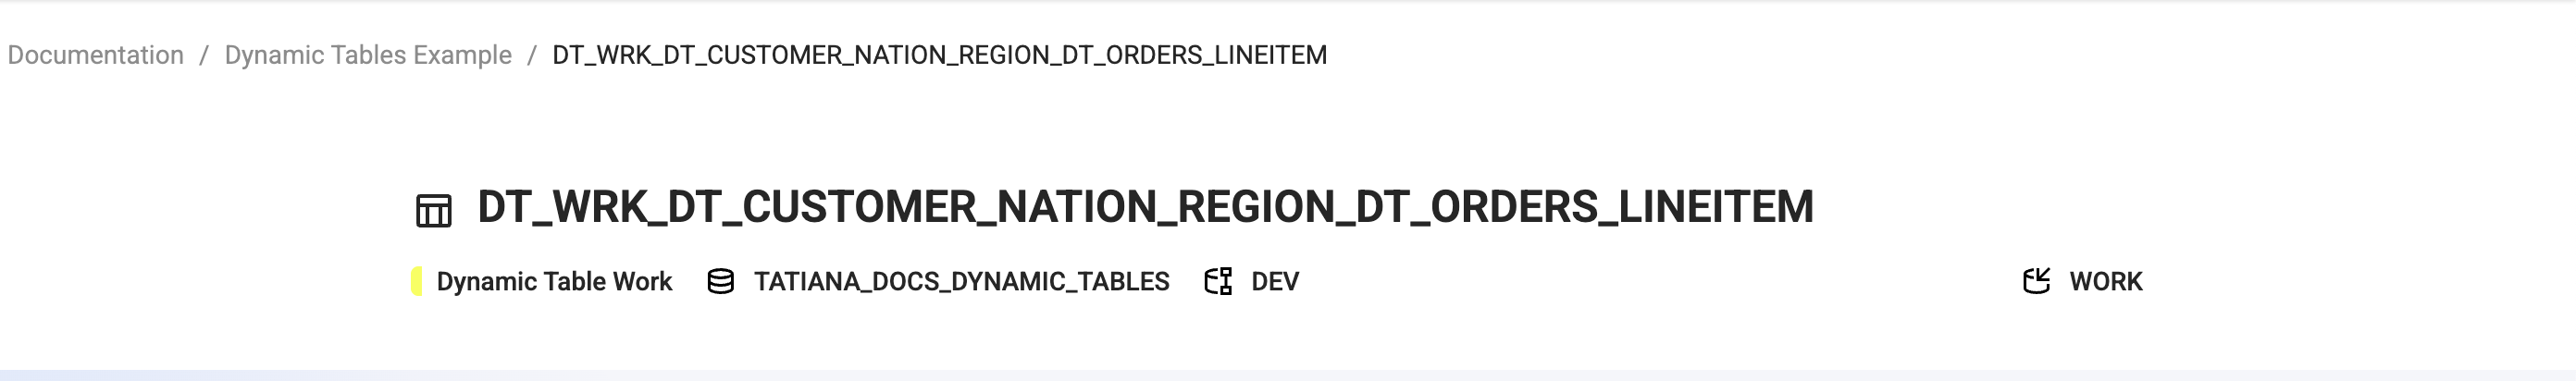
The header shows:
- Node name -
DT_WRK_DT_CUSTOMER_NATION_REGION_DT_ORDERS_LINEITEM - Node Type -
Dynamic Table Work. - Database -
TATIANA_DOCS_DYNAMIC_TABLES - Table -
DEV - Storage Location -
WORK
Information is organized into the following sections.
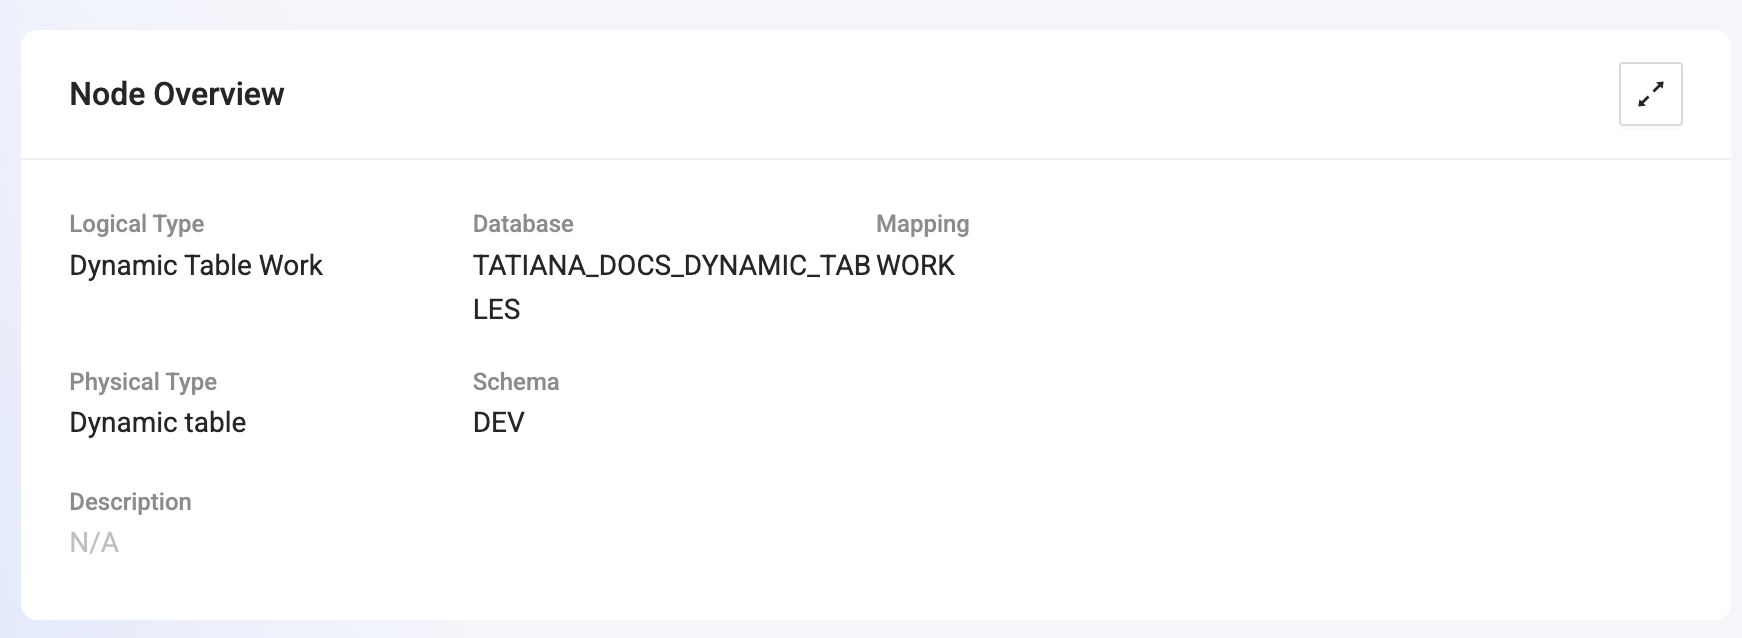
Overview
General information about a Node.
Columns
Shows all the columns in a Node.
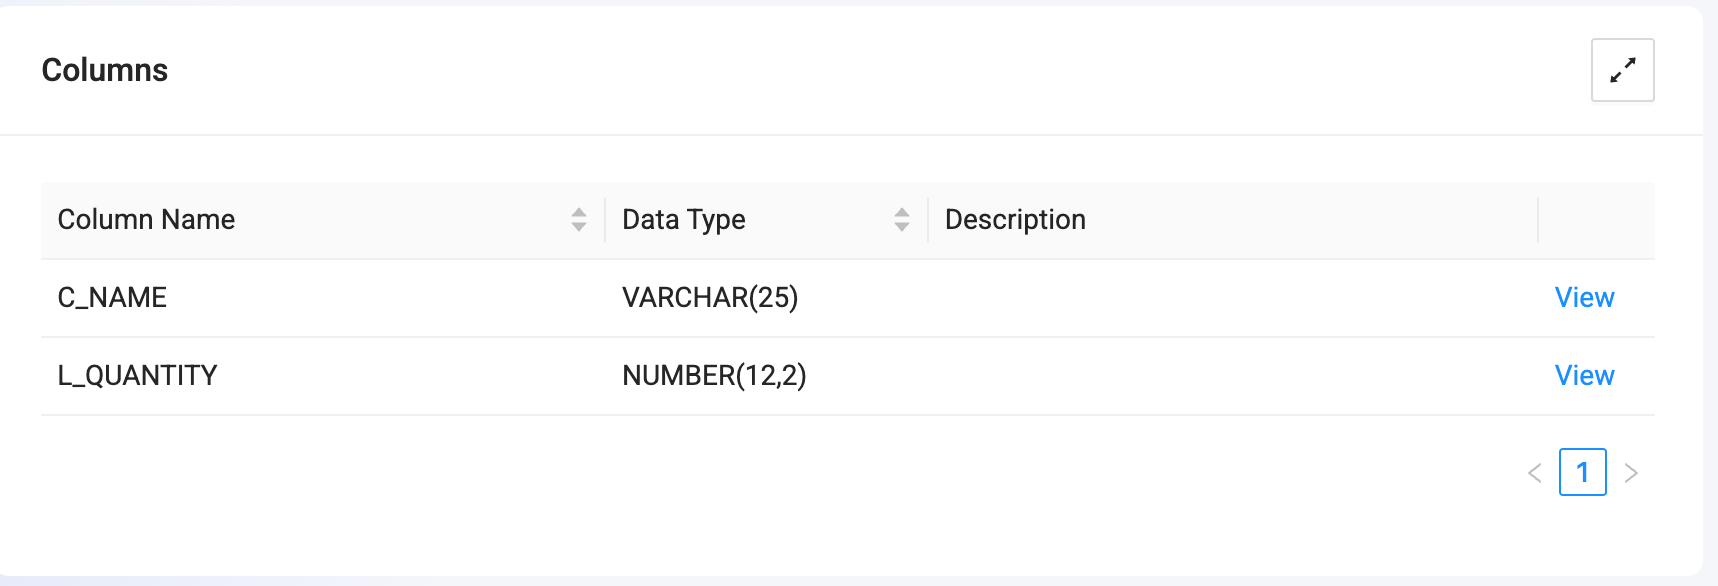
Column View
Click View next to a column to display its information, including the column name and its parent.
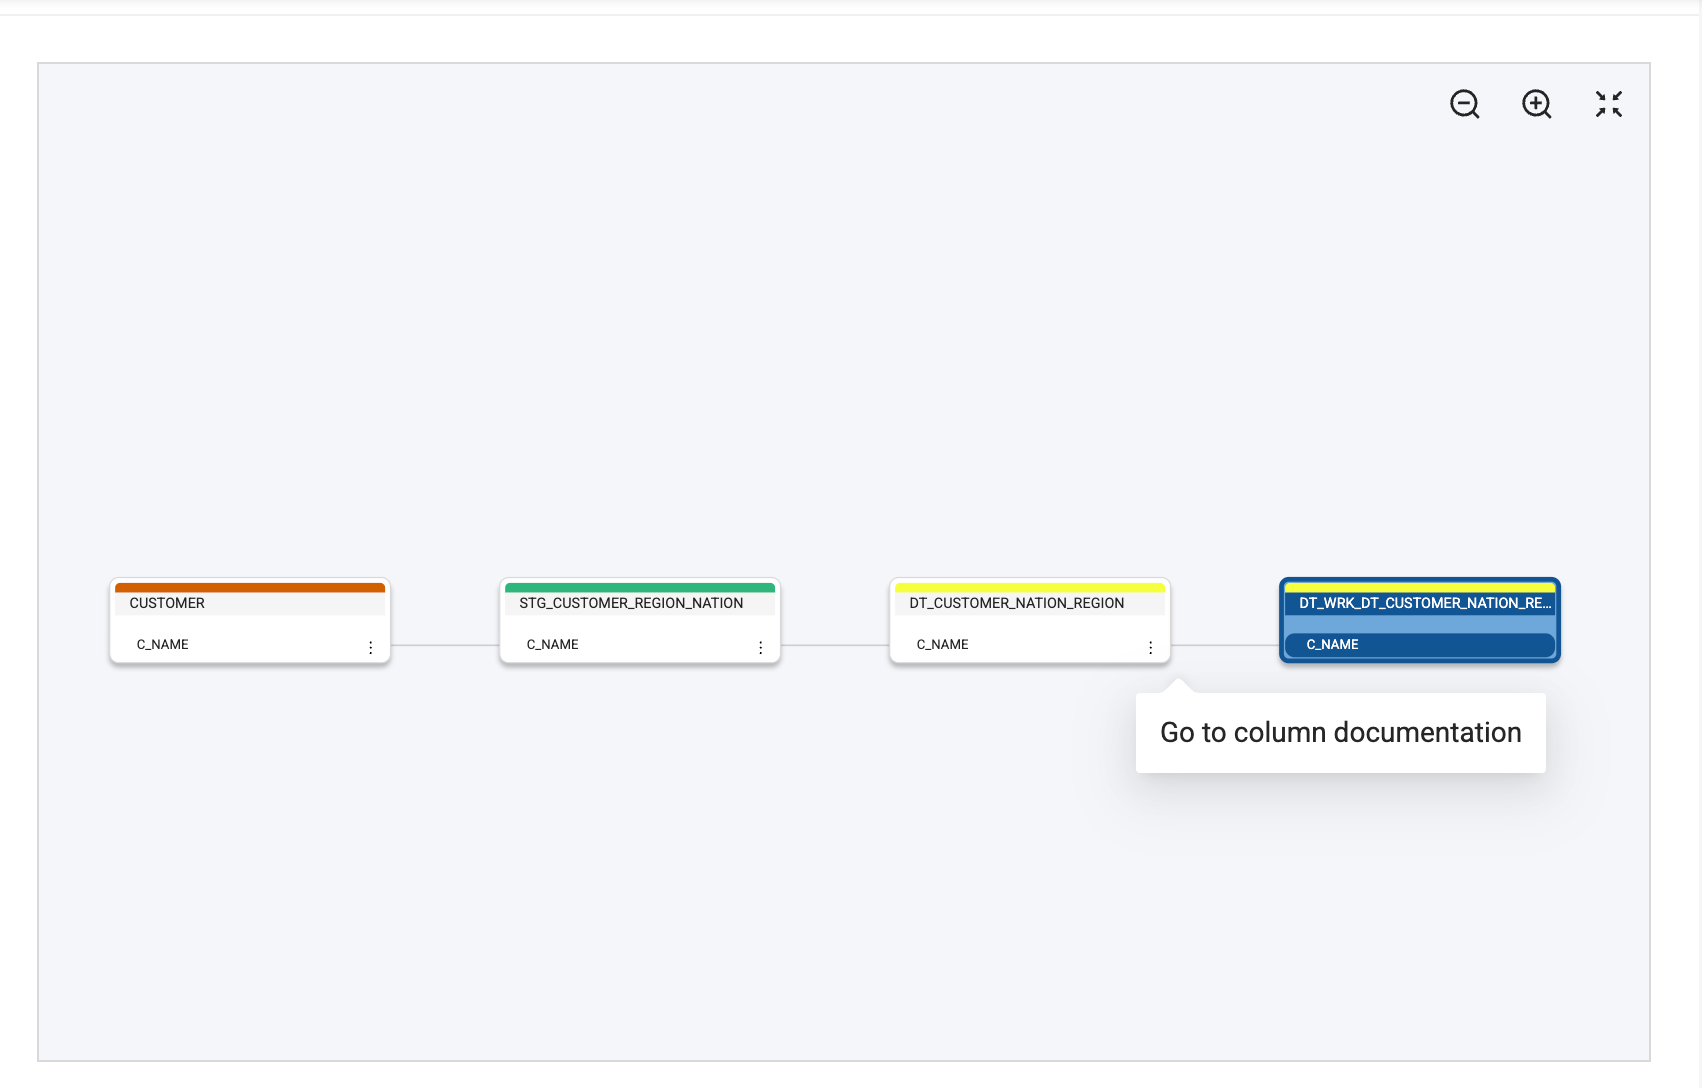
The column lineage can be navigated by clicking on the ellipses and clicking Go to column documentation. It will then take you to the documentation for that column in the preceding Node. You can continue to do that for each column in the lineage. Return to the Node Overview by clicking the Node name.
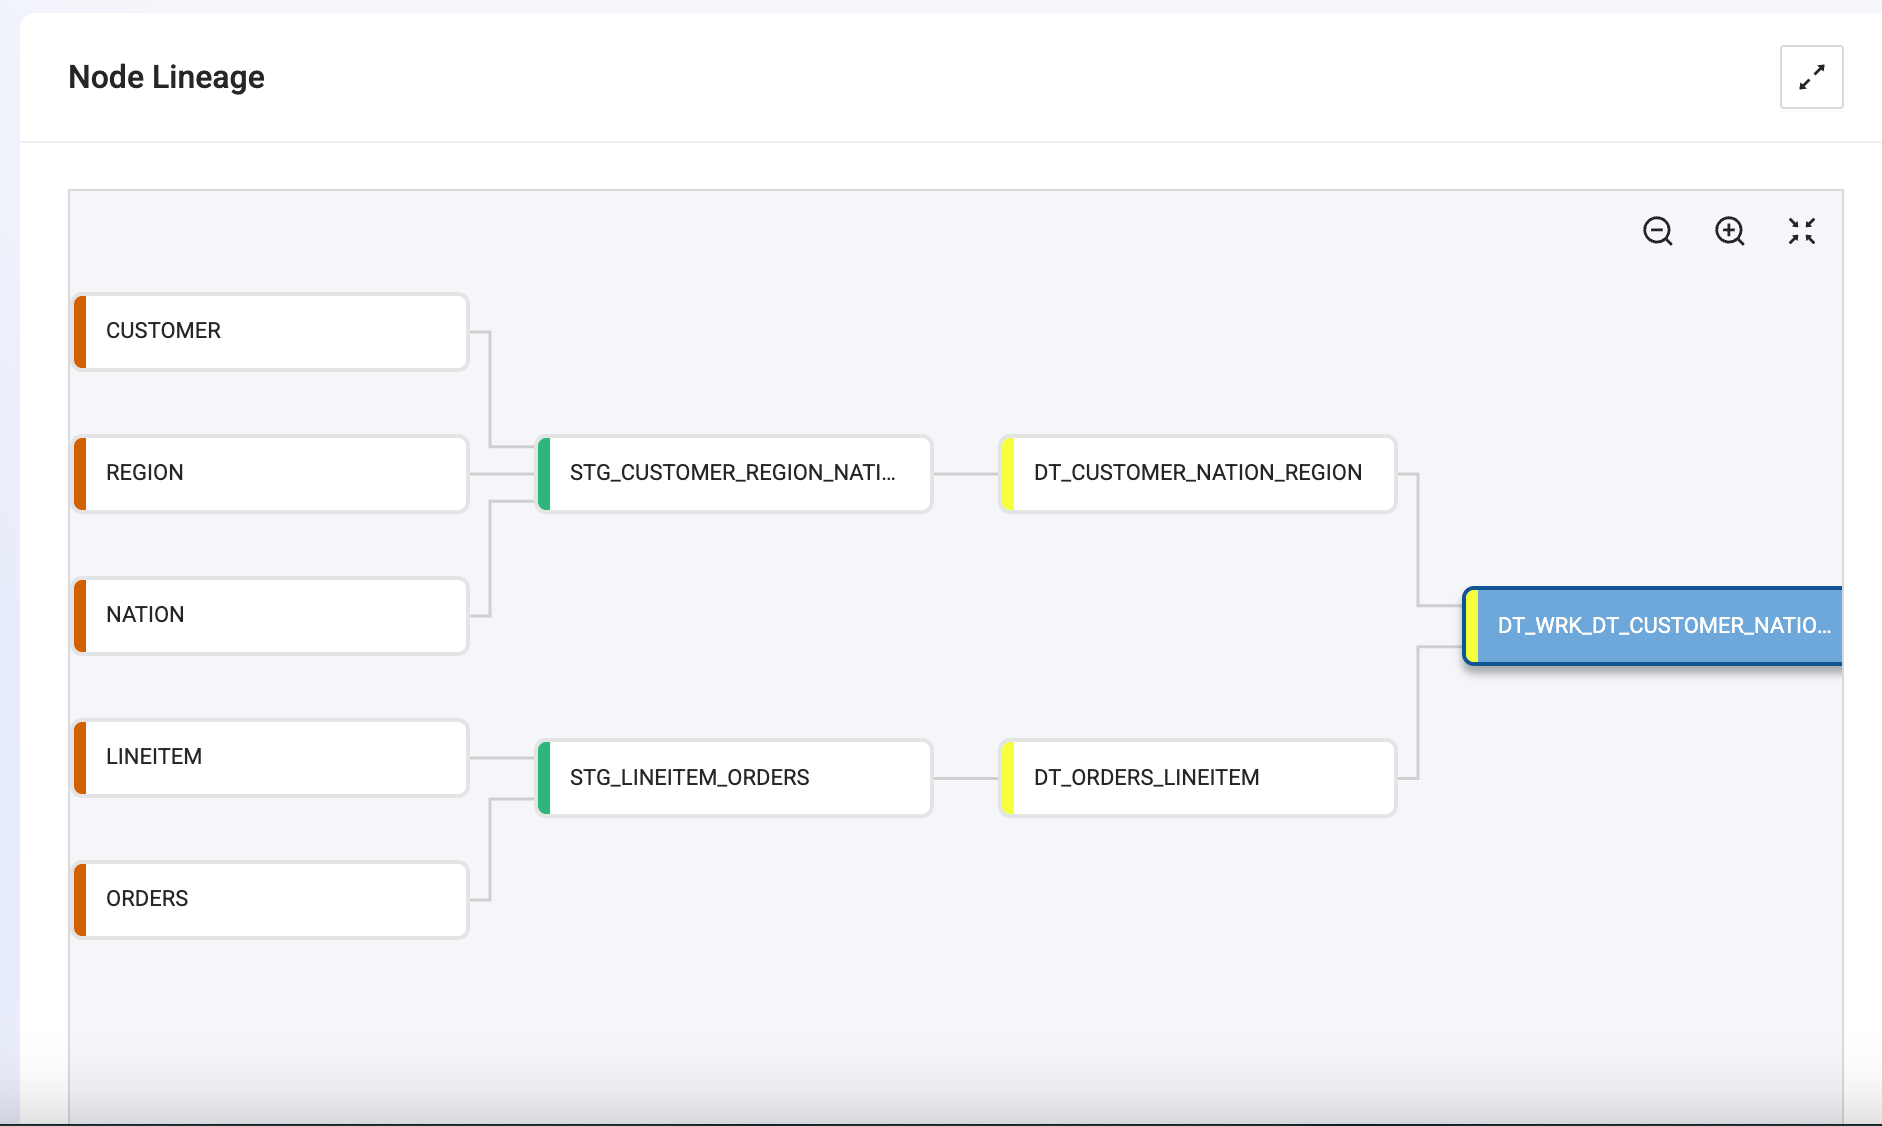
Lineage
This shows the Node Lineage. Use the controls to move around the Node.
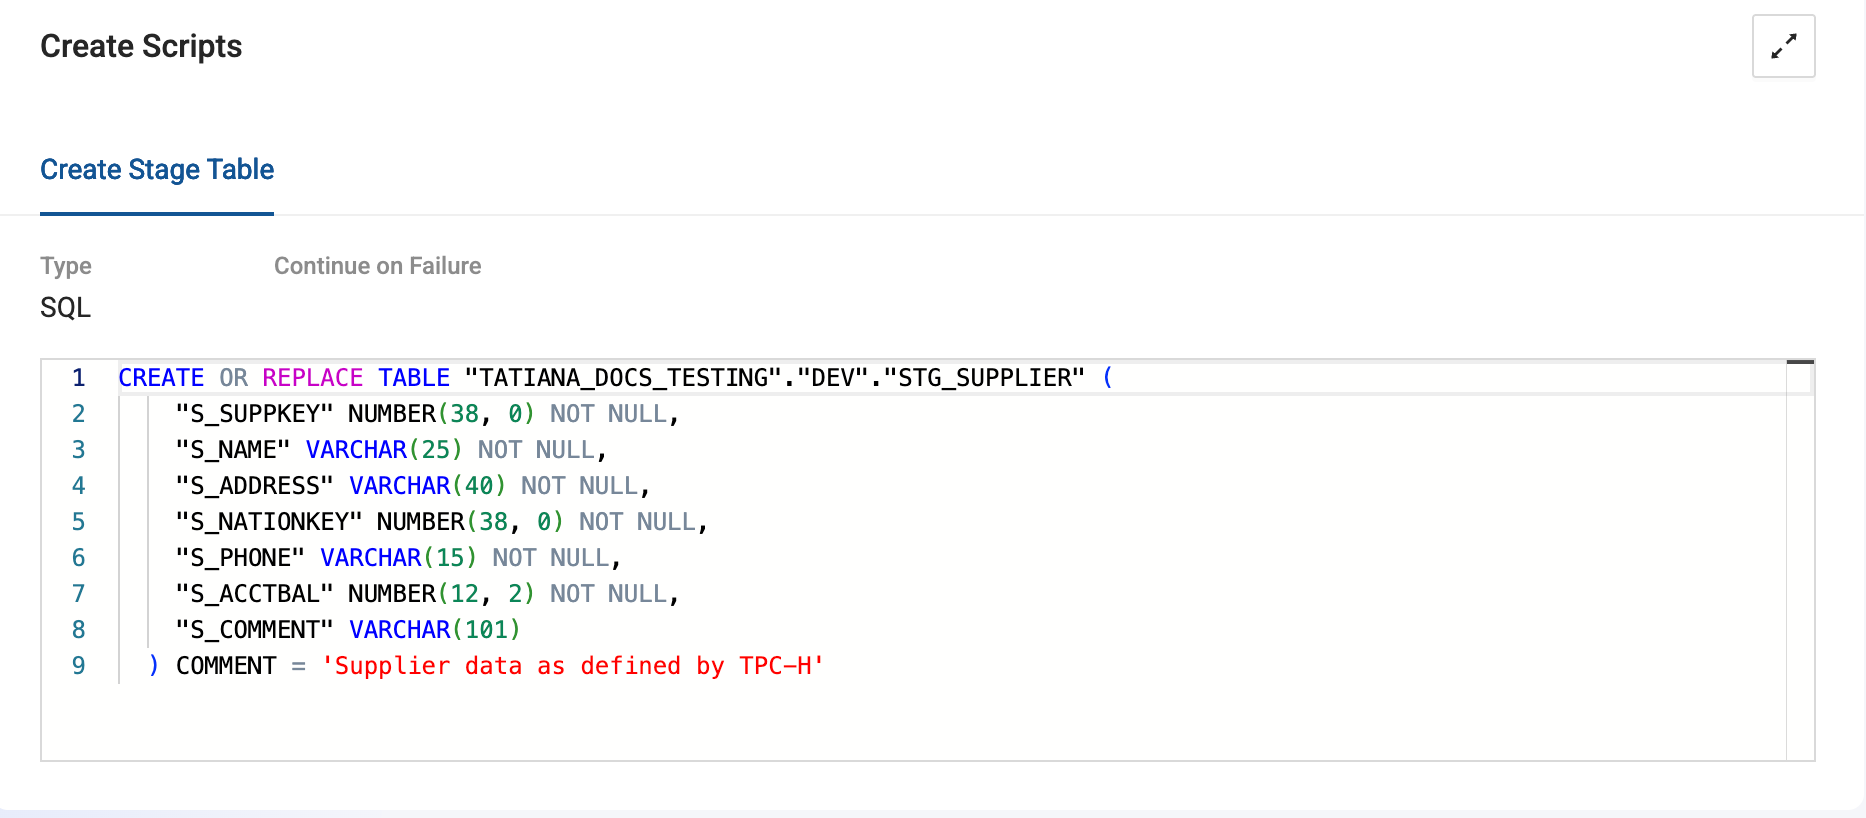
Create Scripts
Any scripts that ran as part of the Create function. If there is more than one, it will be another tab.
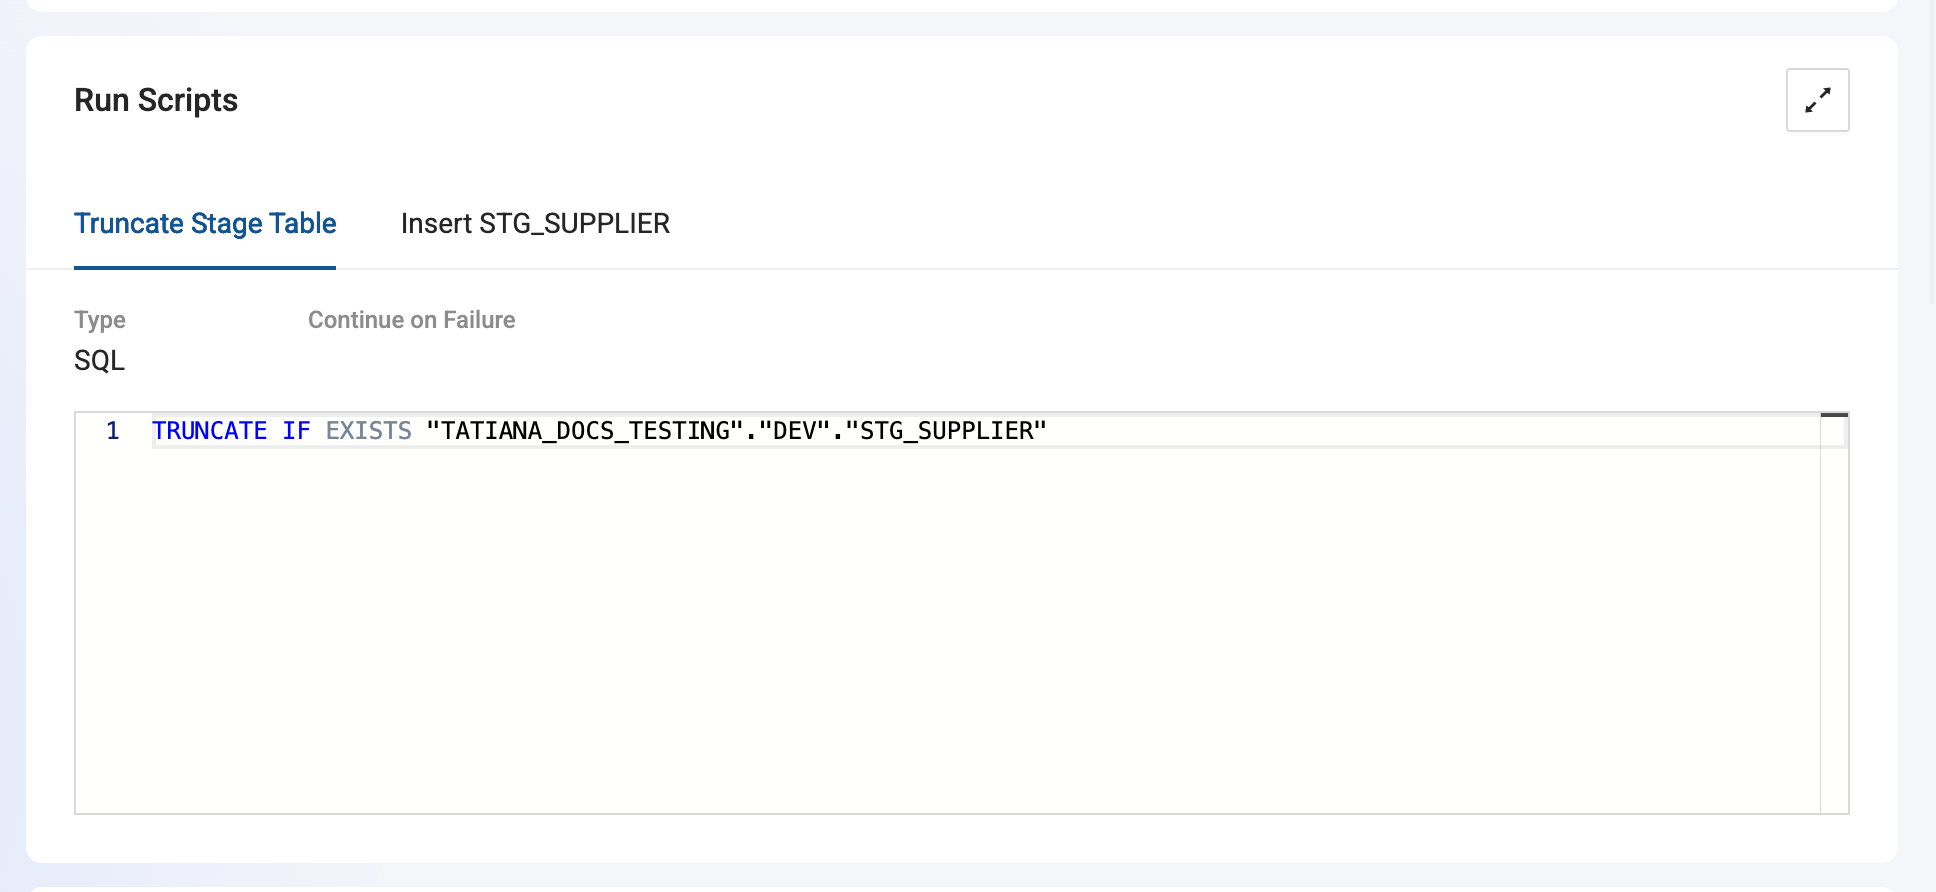
Run Scripts
Any scripts that ran as part of the Run function. If there is more than one, it will be another tab.
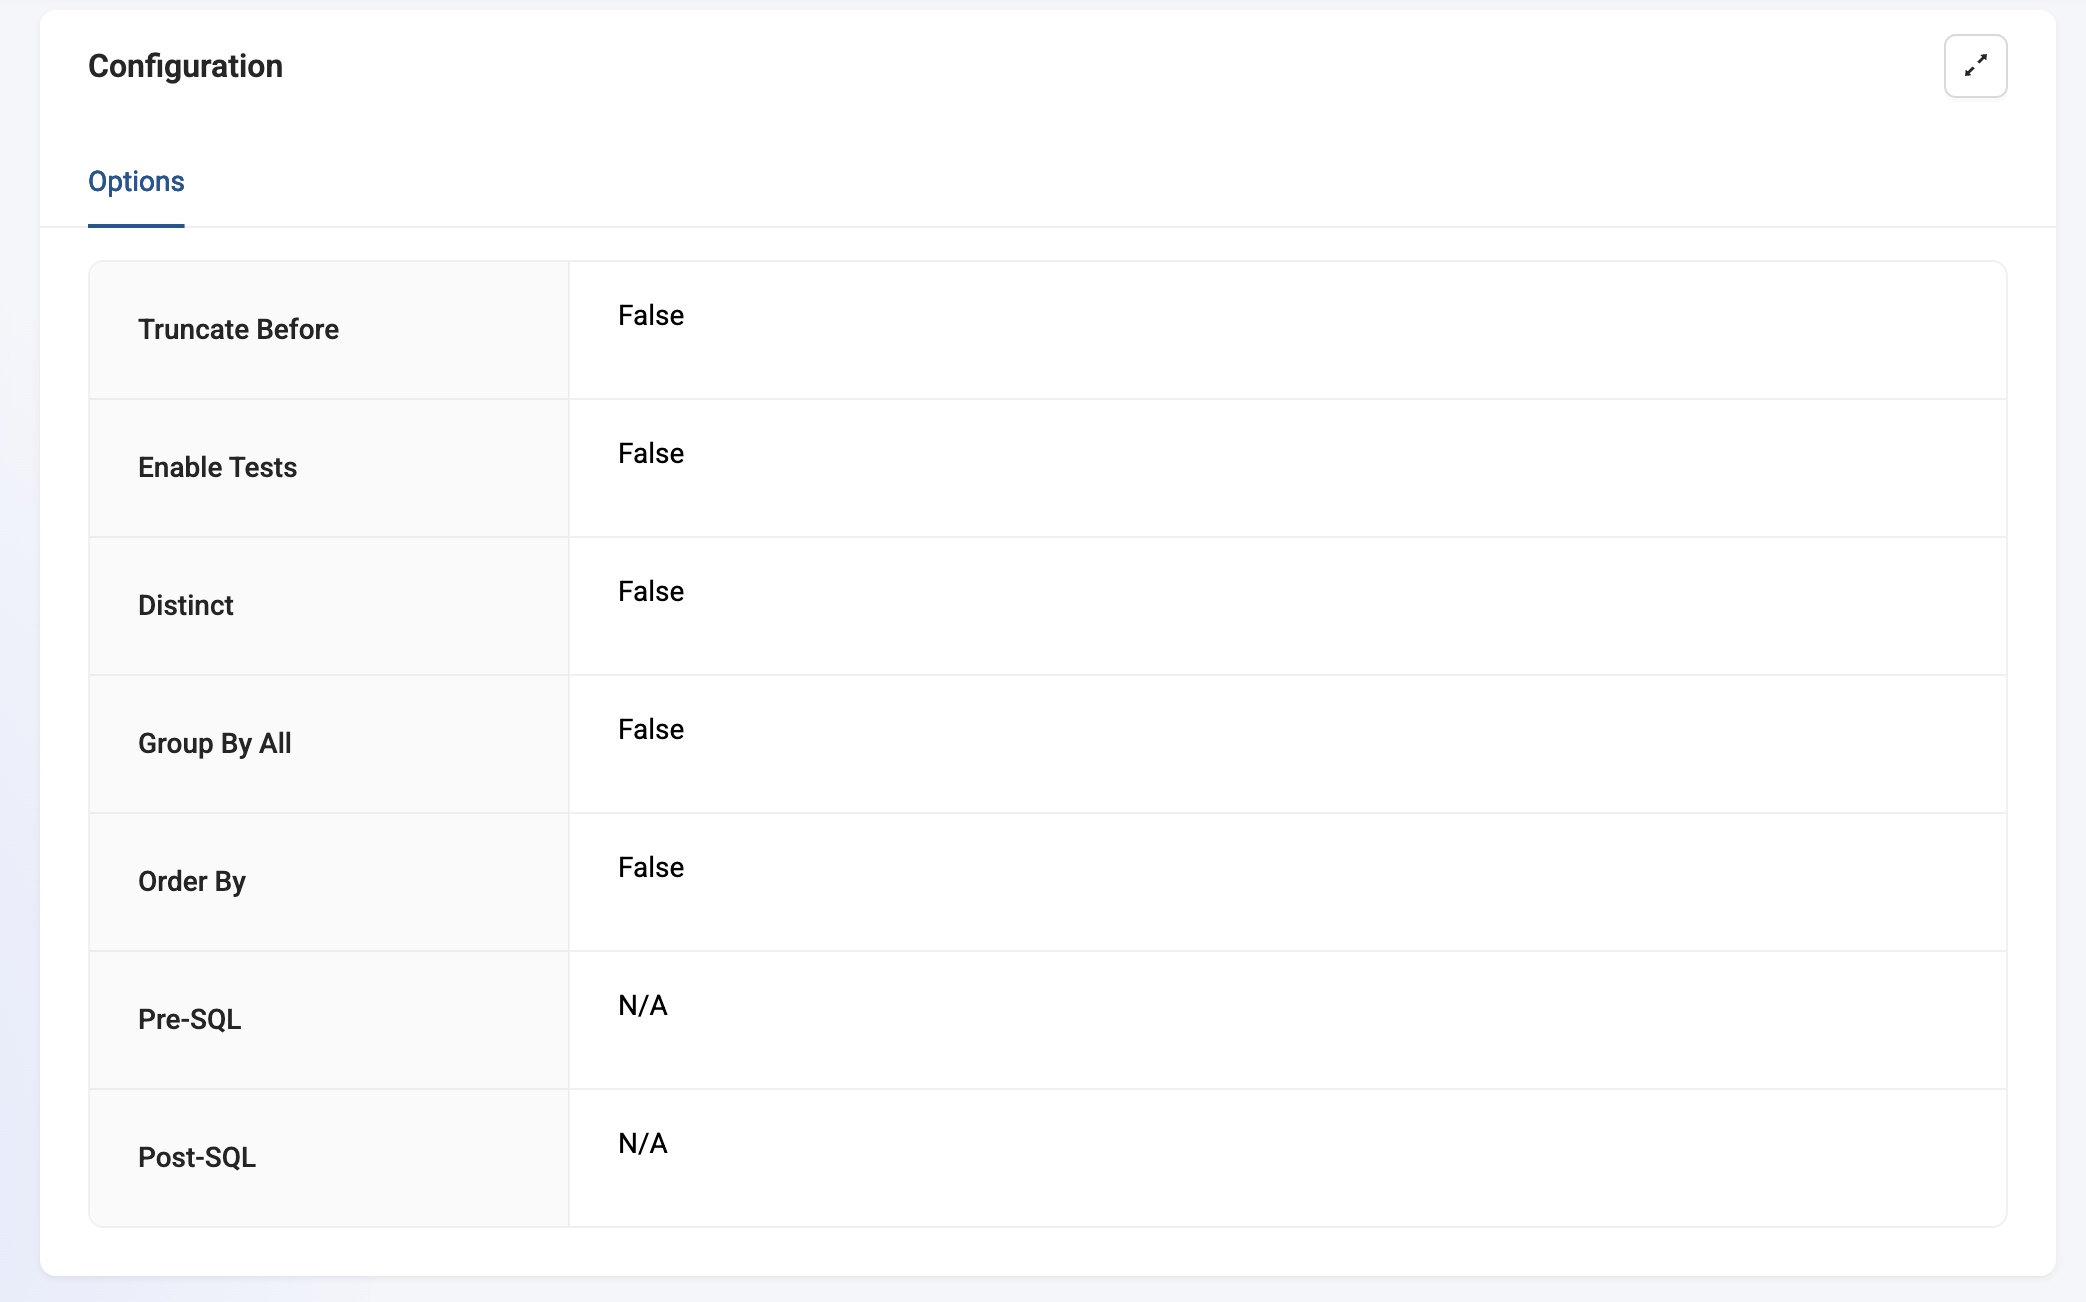
Configuration
Any configuration options available for the Node. This can vary depending on the Node.