Documentation index: llms.txt. This page is also available as markdown: append .md to this URL or send Accept: text/markdown.
Troubleshooting Deploys and Refreshes
You can view the results of a deploy or refresh three ways:
- The Deploy Page
- API
- CLI
Common Deployment Failure Scenarios
When a deployment fails, the cause often falls into one of these categories. Use the table below to find where to get help.
| Scenario | Where to find help |
|---|---|
| COA deployment errors (permissions, Snowflake view validation, blank columns) | COA Deployment Error Resolution |
| Storage mapping errors (invalid database/schema, orphaned locations, missing mappings) | Storage Mapping Deployment Failures |
| Deployment failed and refresh is blocked | When deployment fails and refresh is blocked |
| Plan failures (unexpected renames, dropped tables, metadata drift) | Plan failures |
| Data type changes in Snowflake (unsupported ALTER COLUMN, copy-table migration) | Data Type Changes in Snowflake |
| Deploy plan shows Replace Table, Create Table, or unexpected table re-creation (Snowflake) | Snowflake Table Re-creation During Deployment |
Deployment timeouts (DEADLINE_EXCEEDED, frozen UI), or runs that never start or stay queued | Job timeouts and run failures |
| Snowflake authentication (key pair, auth policies, connection failures) | Snowflake Key Pair Authentication |
When Deployment Fails and Refresh Is Blocked
When a deployment fails, refresh is blocked until the deployment is fixed. You have a few options:
- Fix and retry: Resolve the underlying error (for example, fix Storage Mappings or permissions), then redeploy. Once deployment succeeds, refresh will run normally.
- Rollback: Redeploy the previous successful commit to restore the Environment to a known-good state. See Rollback a Deployment.
- Force refresh (use with caution): If you're sure the failed deployment doesn't affect the Nodes you need to refresh, you can use
forceIgnoreWorkspaceStatusto allow refresh to proceed. See Managing Refresh Jobs in Failed Deployment Environments.
Only use forceIgnoreWorkspaceStatus when you've confirmed the Nodes in your refresh job are unaffected by the failed deployment. Running refresh in a partially deployed Environment can cause inconsistent or incorrect data.
If the underlying problem is a timeout, frozen UI, or a Job that never starts or stays queued, see Job timeouts and run failures.
Plan Failures
Deployment plans can fail when Coalesce detects unexpected changes between your Workspace and the target Environment. Common causes include:
- Unexpected table renames or dropped tables: Objects were changed or removed directly in the data platform.
- Metadata drift: Column types, names, or structures differ from what Coalesce expects.
- Storage mapping issues: Missing or invalid mappings for Storage Locations used by your Nodes.
For details on how Coalesce reconciles these differences, see Understanding Presync. For Storage Mapping errors, see Storage Mapping Deployment Failures.
The Deploy Page
On the Deploy Page you can check the status of current or completed runs.
The feed includes:
- Connection details
- Parameters used
- Details for each Node and its steps
- Query ID
- Error messages
SnowflakeQuery ID only supported for Snowflake.
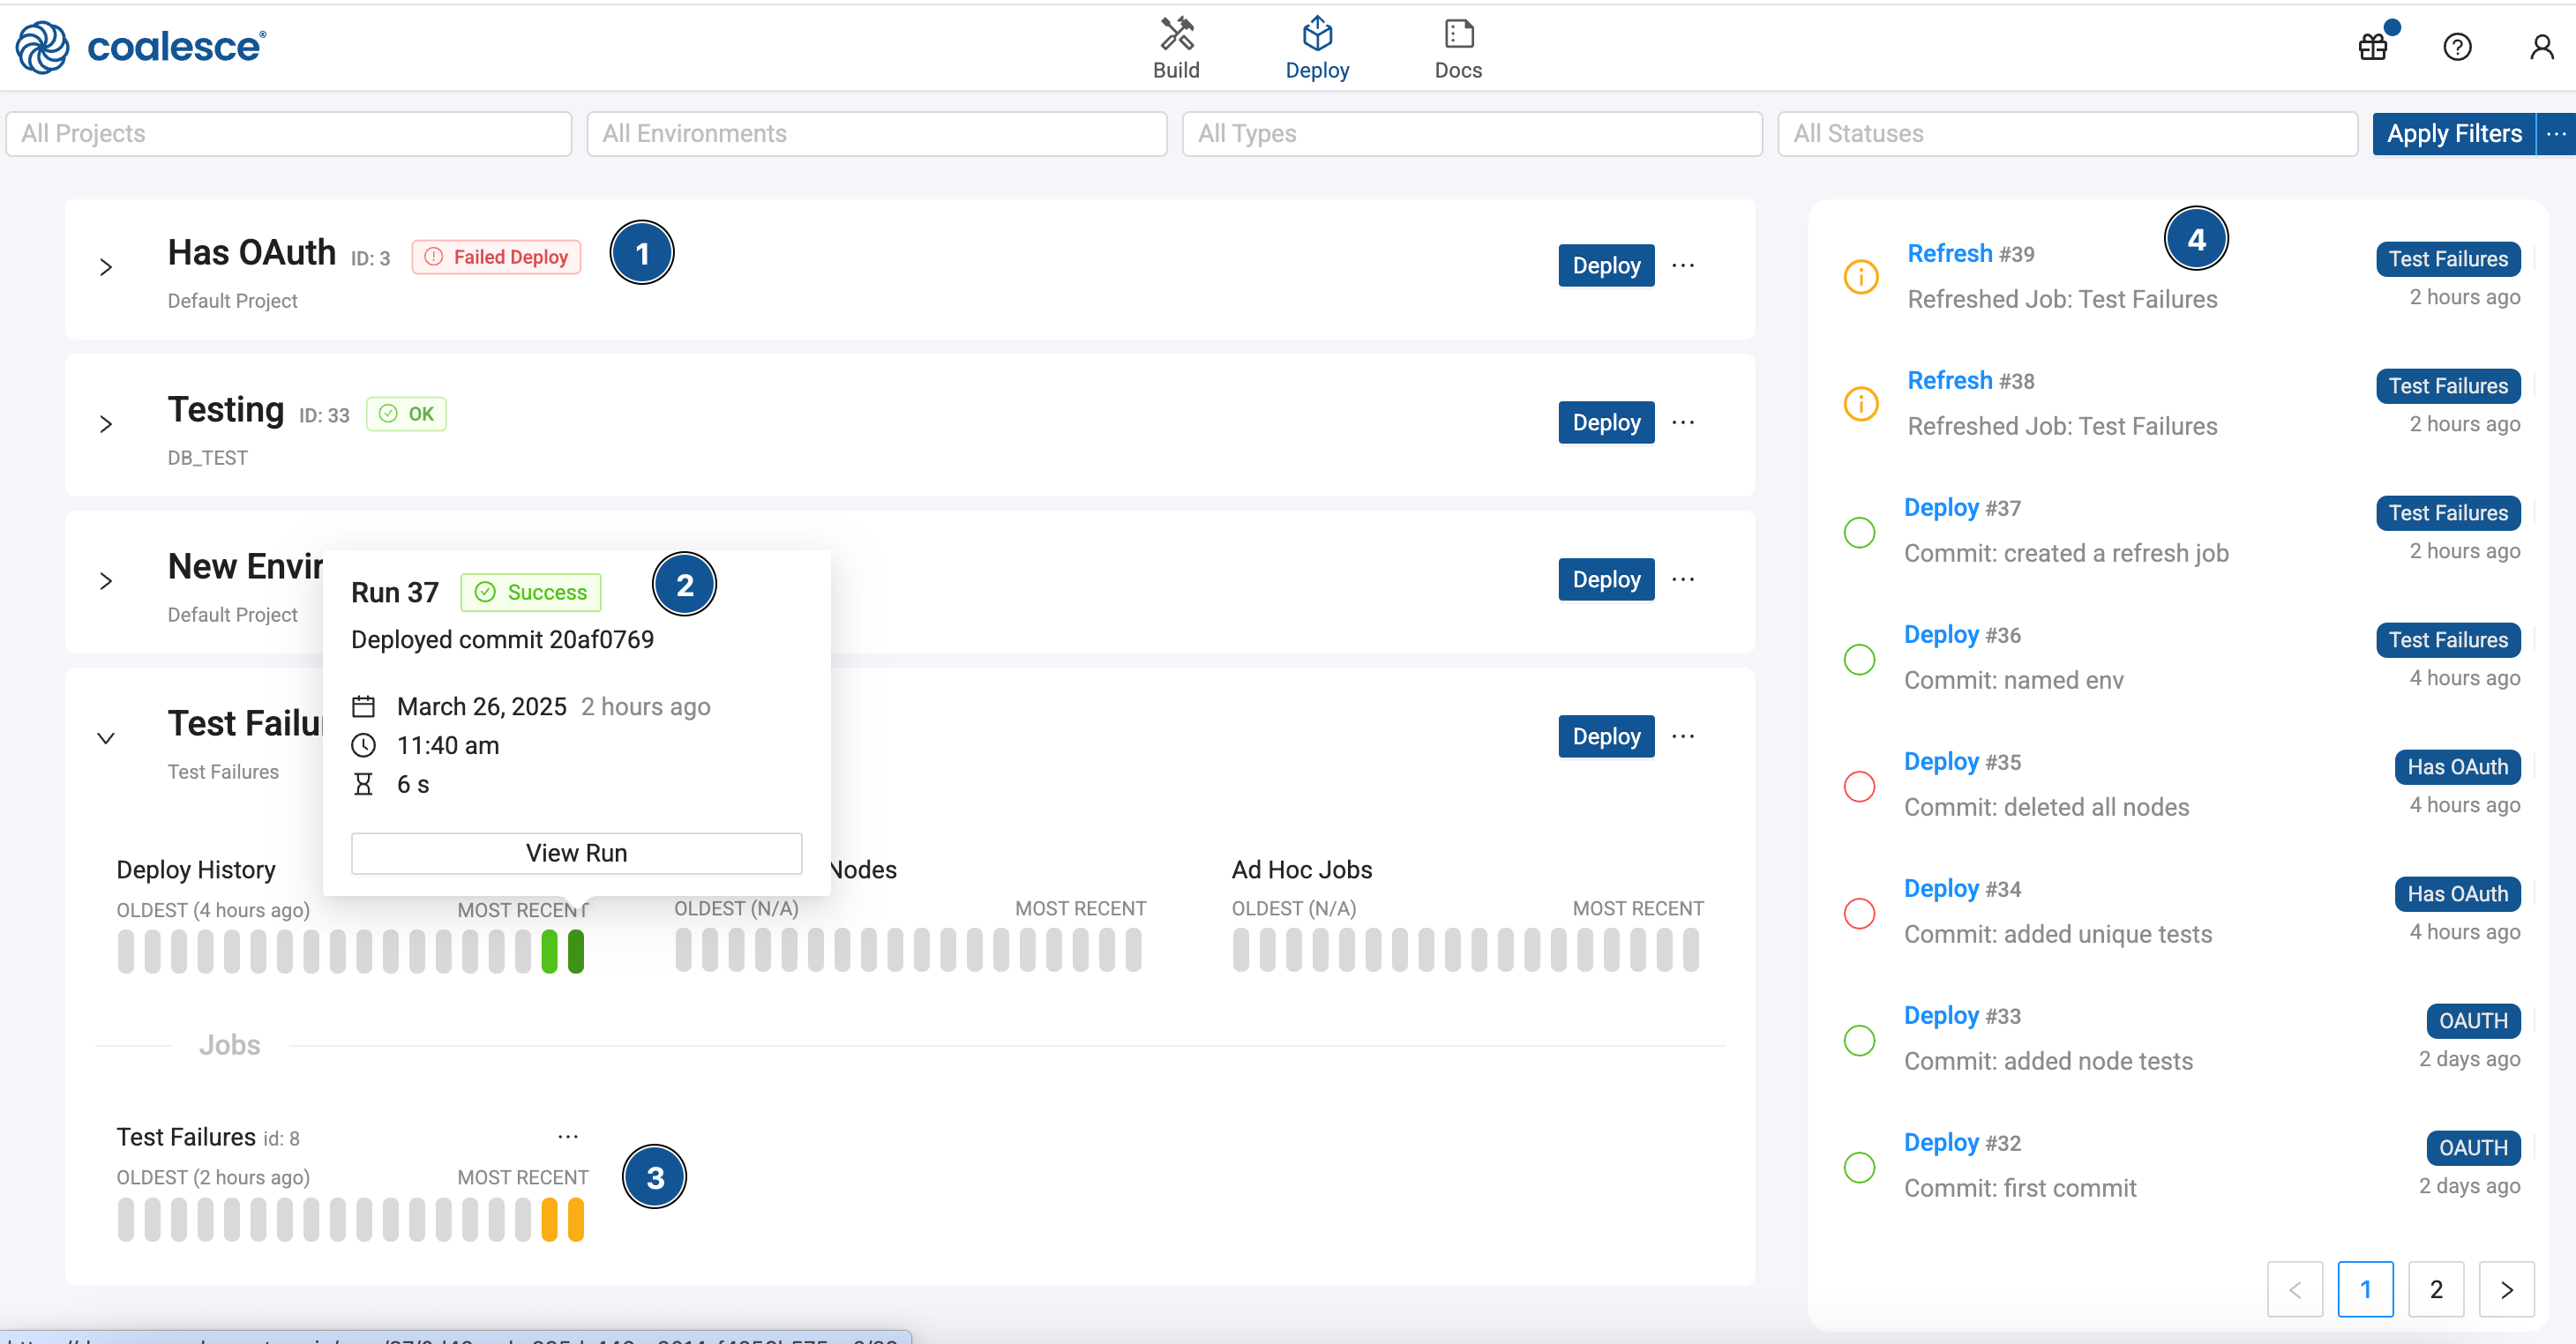
- The run status next to the Environment name.
- Open each Environment to see the status of deploys and refreshes. They are color coded. You can hover over each one to get a quick overview of the run information.
- The type of run and the status is color coded.
- A list of all the runs, the type, and status.
The color will depend on the status:
- Green: The run was successful with no errors.
- Yellow: The Refresh was successful, but had column or Node test failures.
- Red: The Deploy or Refresh failed.
Individual Run Page
Clicking on any of the Deploy or Refresh statuses will take you to the Individual Run Page.
Understanding the Individual Run Page
In this example, you'll review a failed deployment, but this can also be applied to Refresh and Jobs.
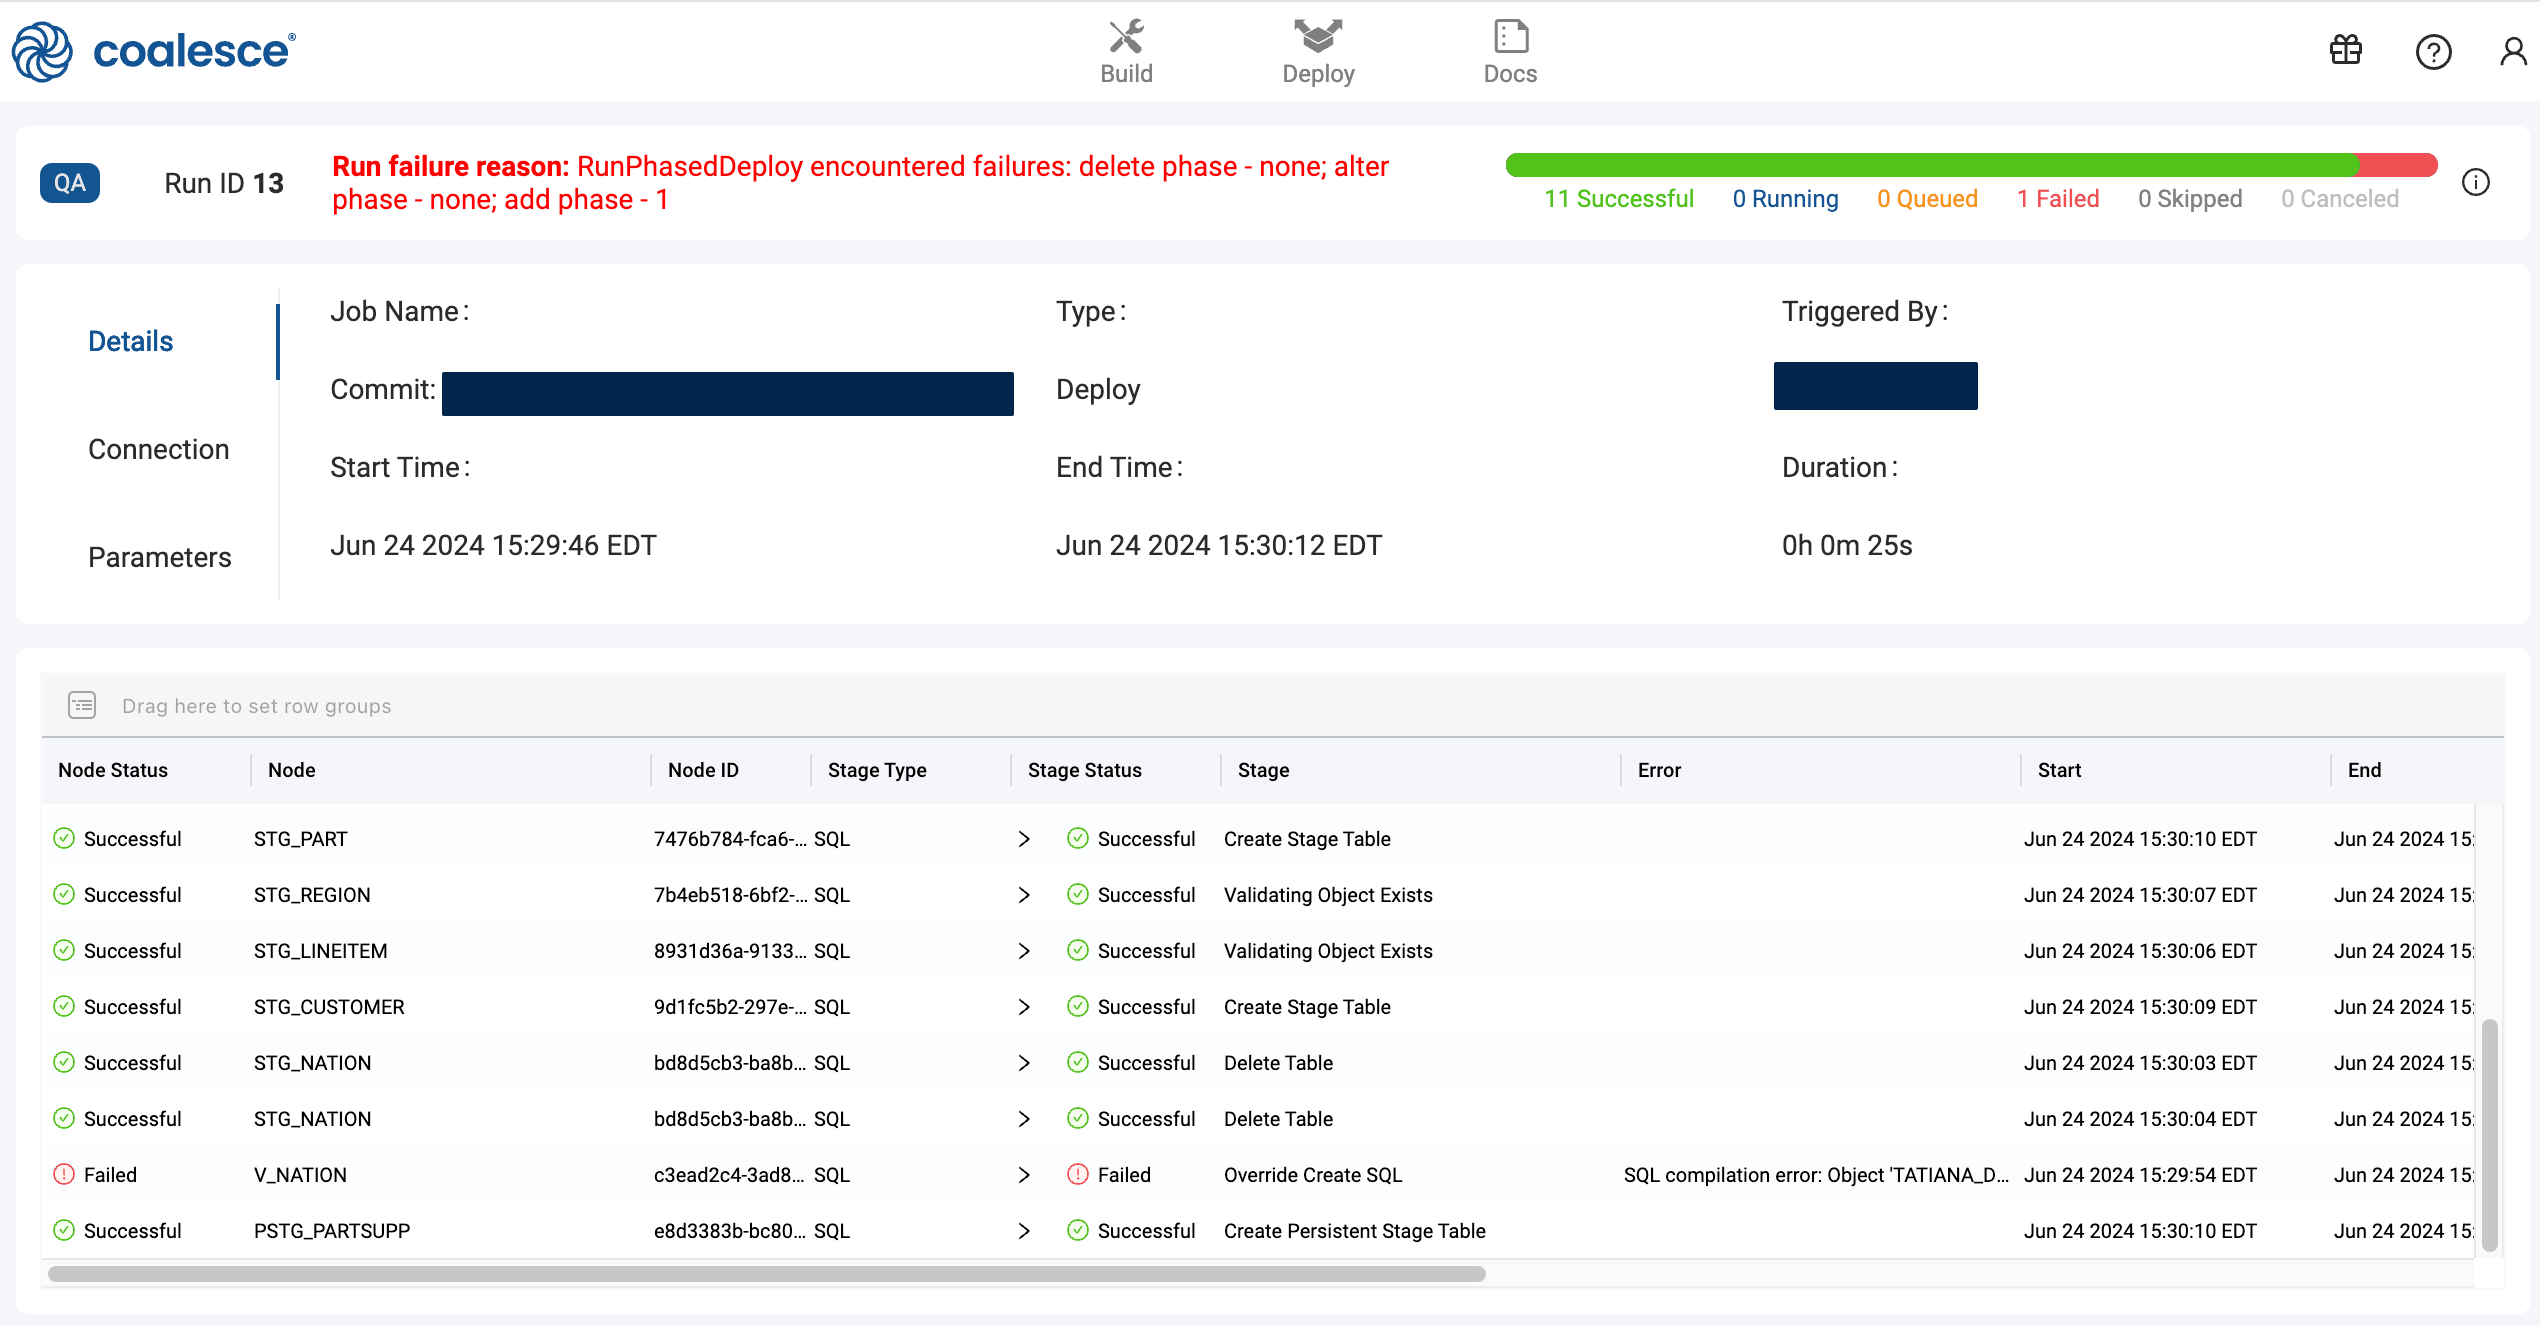
The heading contains:
- The phase and number of Nodes that failed in that phase. In this example it's one Node in the add phase.
Run failure reason: RunPhasedDeploy encountered failures: delete phase - none; alter phase - none; add phase - 1 - The status and number of Nodes. In this example, 11 were successful and 1 failed.
The row contains:
- The failed Node. The failed Node in this example is
V_Nation.
Double-clicking on the error will open a new window that includes the error message and the SQL for that stage.
The error for this run is SQL compilation error: Object 'DOCS_TESTING.DEV.STG_NATION1' does not exist or not authorized.
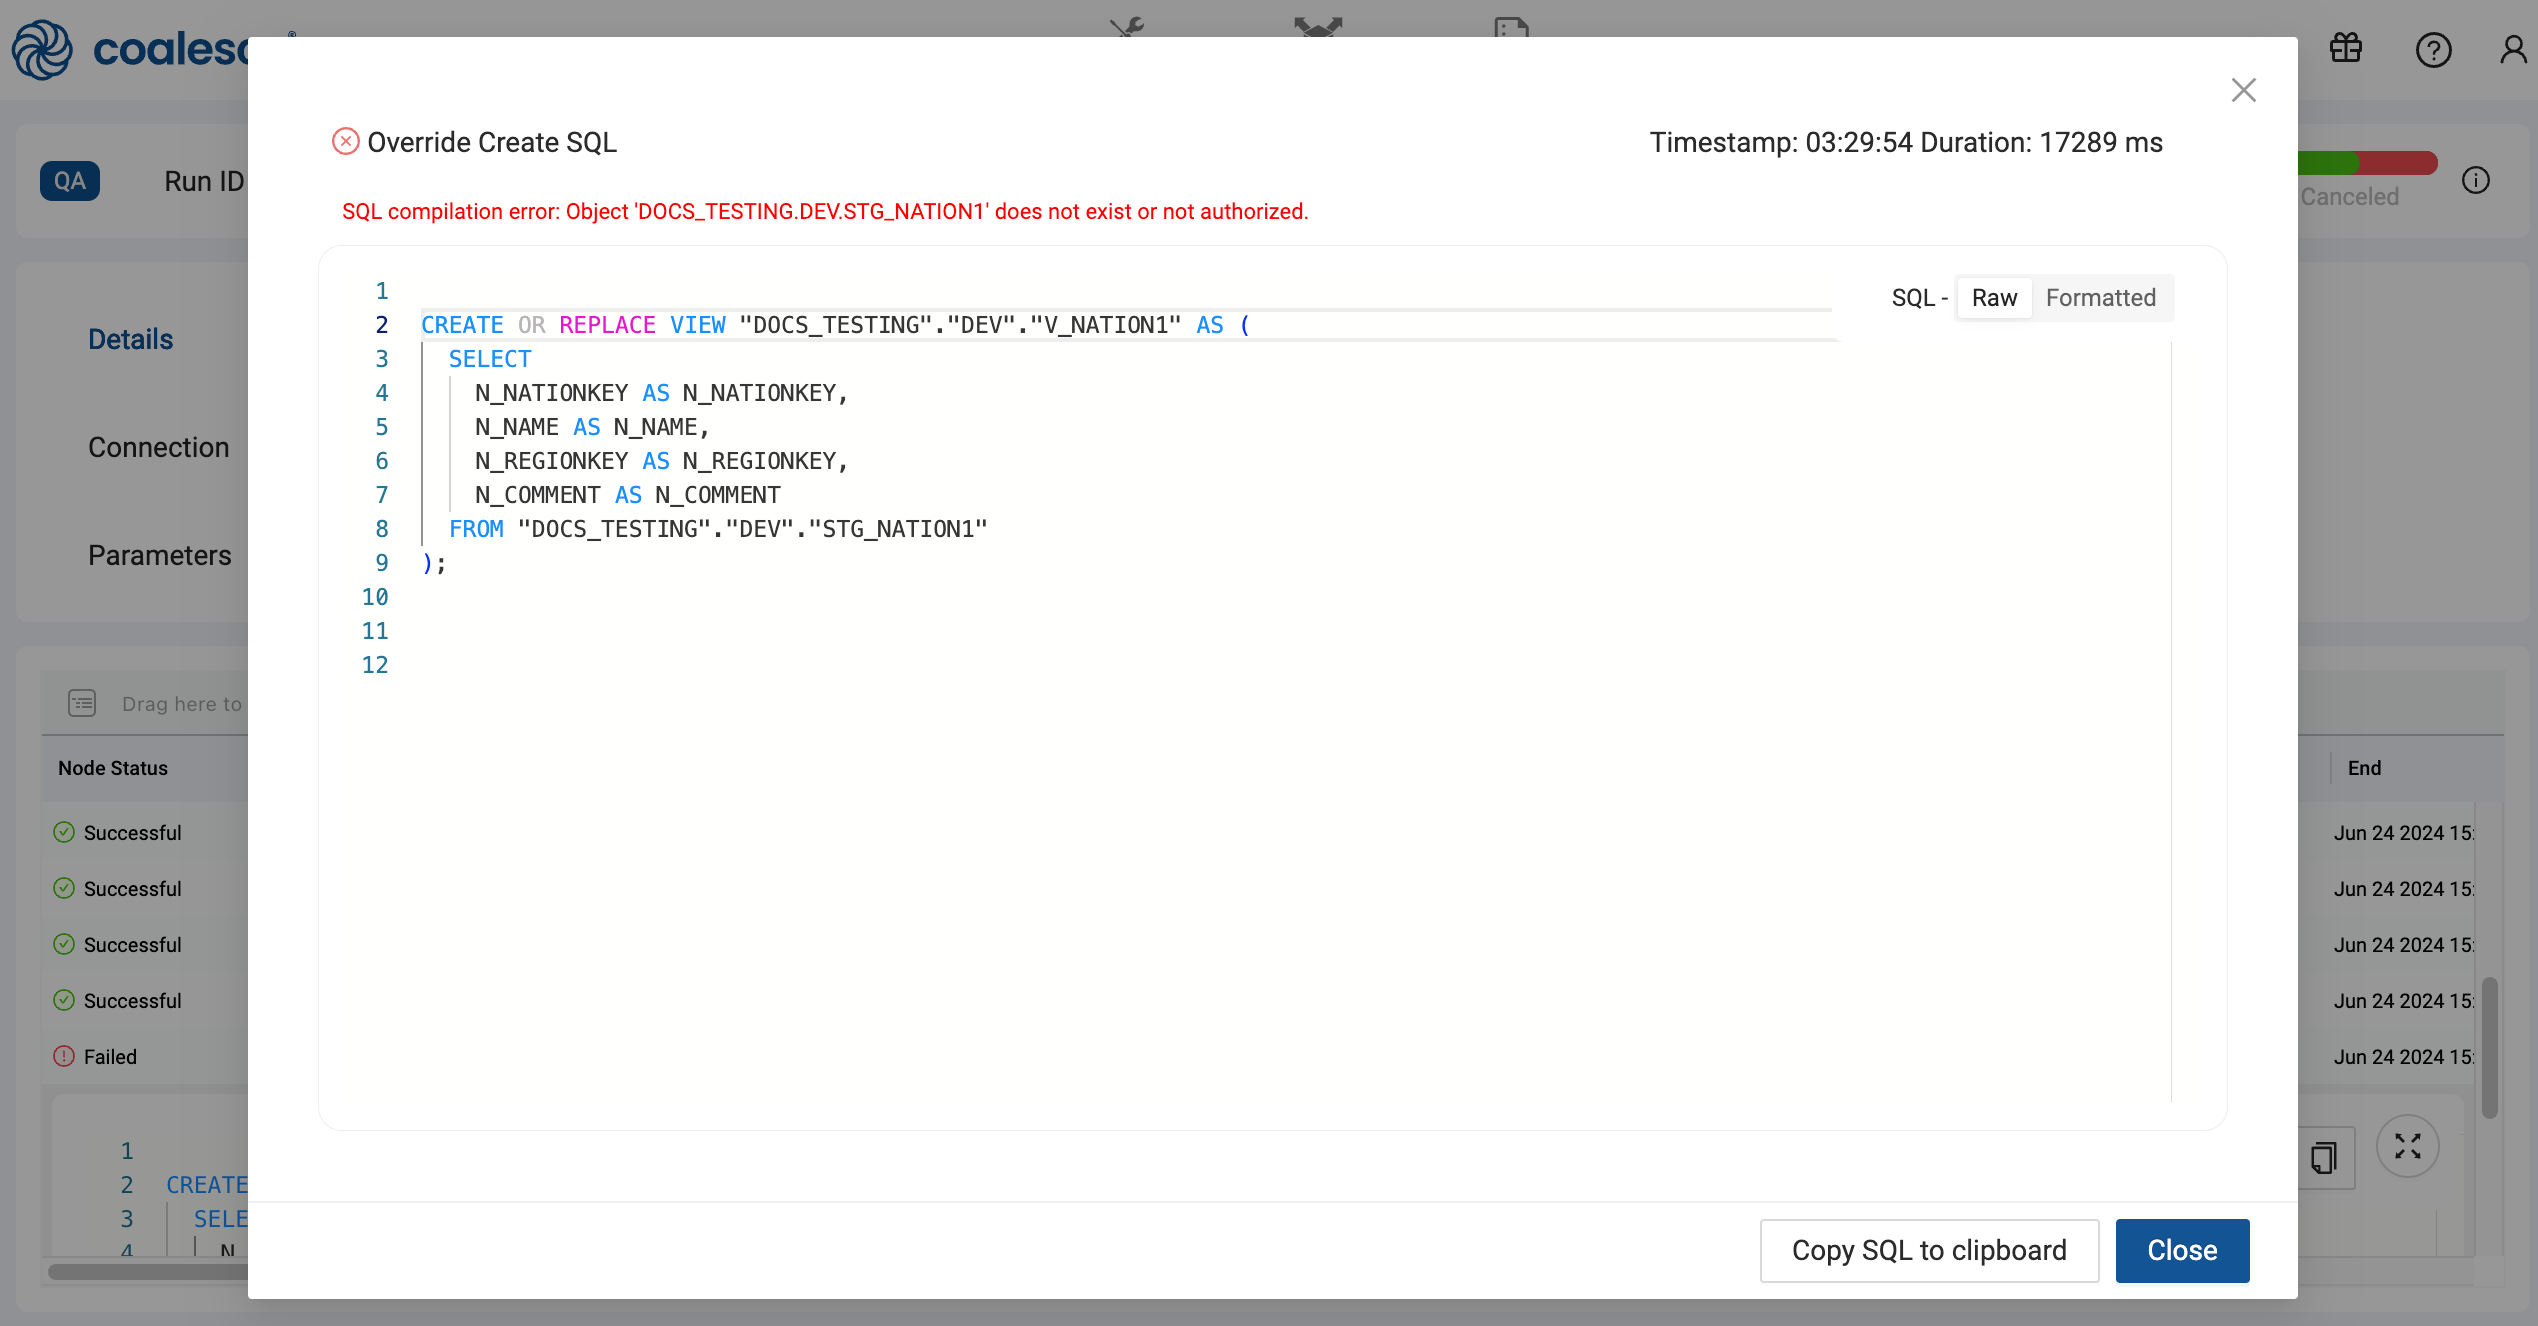
Once the error is resolved, you can run the Job from the point of failure, rollback your deployment, or update your pipeline and redeploy.
Deploy and Refresh Status
After a deploy or refresh, you'll be able to see which Nodes were run and their status.
| Status | Description |
|---|---|
| Successful | The Node finished executing all stages successfully. |
| Waiting | The Node is waiting to run. |
| Queued | The Node is part of the current run and is waiting execution. |
| Running | The Node is currently running and stages may have already been completed. |
| Failed | The Node has finished running and encountered an error. Some stages might have completed successfully. |
| Skipped | A step was skipped. Some stages might have completed successfully. |
| Canceled | The run was canceled while running. Some stages might have completed successfully. |
API Run Status
Use the List Run Results API to get the results of a deploy or refresh.
In this example, you'll review a failed deployment, but this can also be applied to Refresh and Jobs.
    {
      "nodeID": "97378833-0000-46bc-9582-e68ded3ae016",
      "runState": "error",
      "isRunning": false,
      "name": "STG_ORDERS",
      "queryResults": [
        {
          "endTime": "2024-07-16T15:13:19.357Z",
          "error": {
            "errorString": "SQL compilation error:\nDatabase 'DOCUMENTATION_SNOWFLAKE_TEST' does not exist or not authorized.",
            "errorDetail": "002003"
          },
          "isRunning": false,
          "name": "Delete Table",
          "queryID": "01b5b591-0905-106b-0012-7b030fac7362",
          "sql": "\n    DROP TABLE IF EXISTS \"DOCUMENTATION_SNOWFLAKE_TEST\".\"DEV\".\"STG_ORDERS_COALESCE_INTERNAL_TABLE\"",
          "startTime": "2024-07-16T15:13:10.641Z",
          "status": "Failure",
          "success": false
        }
      ]
    },
...
The response is organized by nodeID. The response will contain the current status, the Node name, the name of the stage that was executed, and the error message if applicable. Review the full response example for all fields.
You can see "nodeID": "97378833-0000-46bc-9582-e68ded3ae016", failed because "SQL compilation error:\nDatabase 'DOCUMENTATION_SNOWFLAKE_TEST' does not exist or not authorized.". The database it was trying to run the stage in does not exist.
Once the error is resolved, you can run the Job from the point of failure, rollback your deployment, or update your pipeline and redeploy.
CLI Run Status
Use coa runs to get the deployment status.
When deploying or refreshing using the CLI, add the --out flag to return in-depth results as JSON. For example, coa deploy --out debug.json.
In this example, you'll review a failed deployment, but this can also be applied to Refresh and Jobs.
....
|2024-07-18T17:00:45.155Z|[RENDERER]()|)|info:Pyodide initialization complete in  1.3305933750000003  seconds
|2024-07-18T17:00:45.159Z|[RENDERER]()|)|info:Pyodide initialization complete in  1.3246505830000004  seconds
|2024-07-18T17:00:45.198Z|[RENDERER]()|)|info:Pyodide initialization complete in  1.363098707999999  seconds
|2024-07-18T17:00:55.135Z|[CLI]|(org:alRPfzuHZouUUN0Zupc9)|(env:2)|(user:Owb7B45m0UNSL4OumkDNpcFifTA3)|run:28)()|)|error:An error occurred during Deployment: {
  error: {
    errorString: 'RunPhasedDeploy encountered failures: \n' +
      '        delete phase - 7; \n' +
      '        alter phase - none; \n' +
      '        add phase - 1\n' +
      '      ',
    errorDetail: 'RunPhasedDeploy encountered failures: \n' +
      '        delete phase - e3e488cc-232f-4e7f-a266-16fe8b4dfd79,e38d8549-bfd0-4044-80ef-108ab297b431,e1e2ea88-de6e-4930-8aaa-dd5ffd1851d9,a7ee70b6-d2a3-4a59-acea-f5a0951b6981,97378833-0000-46bc-9582-e68ded3ae016,3a85b97f-6e6e-4d26-8986-8161f1dd378c,7771b0de-037f-4d9a-a1ad-22400fc0414b; \n' +
      '        alter phase - none; \n' +
      '        add phase - bde6322a-45d0-4964-9606-6a0d0a9867d5\n' +
      '      '
  }
}
When a deploy finishes, it will return a status in the command line.
The errorString will tell you which nodes failed in each phase.
- The delete phase had 7 Nodes that encountered errors.
- The alter phase had no errors.
- The add phase had 1 Node that encountered errors.
The errorDetail will return a list of Node IDs that failed for each phase.
Using JSON Output
By adding --out to return the results as JSON, you can get a detailed error message. Here you can see the error details: SQL compilation error:\nObject 'DOCUMENTATION_DOCS_TESTING.DEV.STG_LINEITEM' does not exist or not authorized."
{
  "runResults": {
    "runStartTime": {
      "seconds": 1721322042,
      "nanoseconds": 300000000
    },
    "runEndTime": {
      "seconds": 1721322054,
      "nanoseconds": 238000000
    },
    "runType": "deploy",
    "runStatus": "failed",
    "runID": 28,
    "runResults": [
      {
        "nodeID": "bde6322a-45d0-4964-9606-6a0d0a9867d5",
        "queryResultSequence": {
          "isRunning": false,
          "name": "STG_LINEITEM",
          "queryResults": [
            {
              "exportedRefs": [],
              "sql": "\nSELECT 1 FROM \"DOCUMENTATION_DOCS_TESTING\".\"DEV\".\"STG_LINEITEM\" LIMIT 0",
              "renderEndTime": {
                "seconds": 1721322044,
                "nanoseconds": 129000000
              },
              "type": "sql",
              "fields": [],
              "startTime": {
                "seconds": 1721322043,
                "nanoseconds": 719000000
              },
              "success": false,
              "error": {
                "errorDetail": "002003",
                "errorString": "SQL compilation error:\nObject 'DOCUMENTATION_DOCS_TESTING.DEV.STG_LINEITEM' does not exist or not authorized."
              },
              "rows": [],
              "stageExecutionStartTime": {
                "seconds": 1721322051,
                "nanoseconds": 791000000
              },
              "invalidExportedRefs": [],
              "warehouse": null,
              "queryID": "01b5c13c-0905-144e-0012-7b030fbc081a",
              "isRunning": false,
              "renderStartTime": {
                "seconds": 1721322043,
                "nanoseconds": 719000000
              },
              "stageExecutionEndTime": {
                "seconds": 1721322053,
                "nanoseconds": 565000000
              },
              "endTime": {
                "seconds": 1721322053,
                "nanoseconds": 565000000
              },
              "name": "Validating Source Exists",
              "status": "Failure"
            }
          ]
        },
        "runState": "error"
      },
Once the error is resolved, you can run the Job from the point of failure, rollback your deployment, or update your pipeline and redeploy.
Node and Column Test Failures
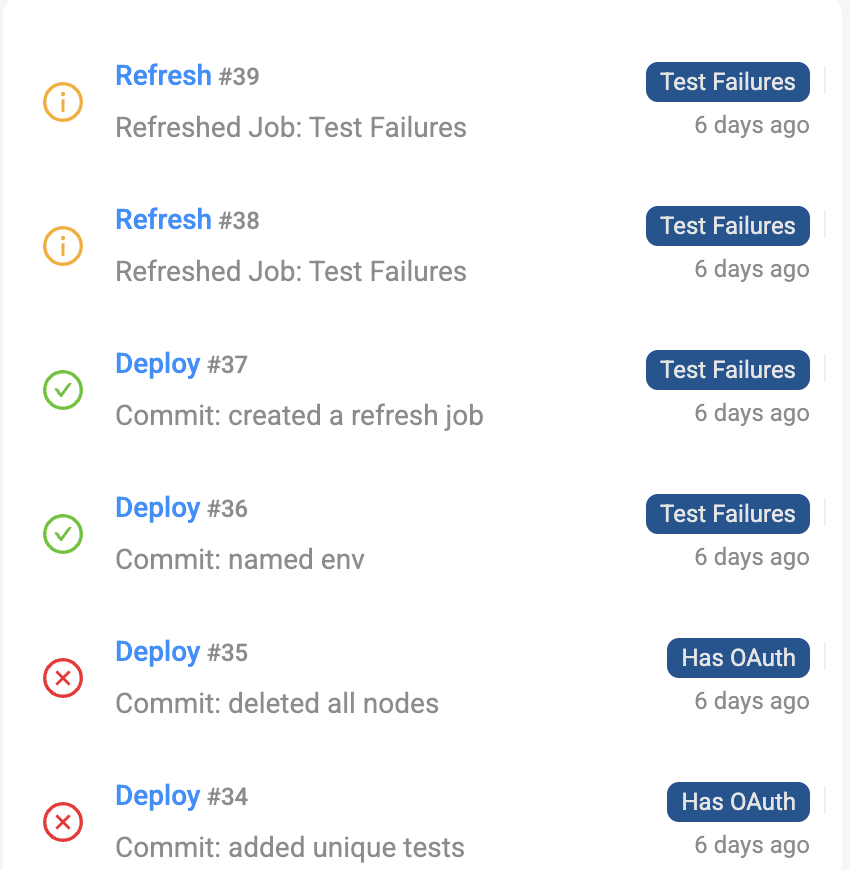
If a Node or column test fails during a Refresh, then the Refresh status will be yellow and the test failure will be in the results. The API will also have a hasTestFailure:true added.
Coalesce App
Failures are also visible on the Individual Run Page, or check the color of a Refresh to see the status.
- Yellow - The Refresh was successful, but had column or Node test failures.
- Red - The Deploy or Refresh failed.
API
The following endpoints will have a hasTestFailure:true added:
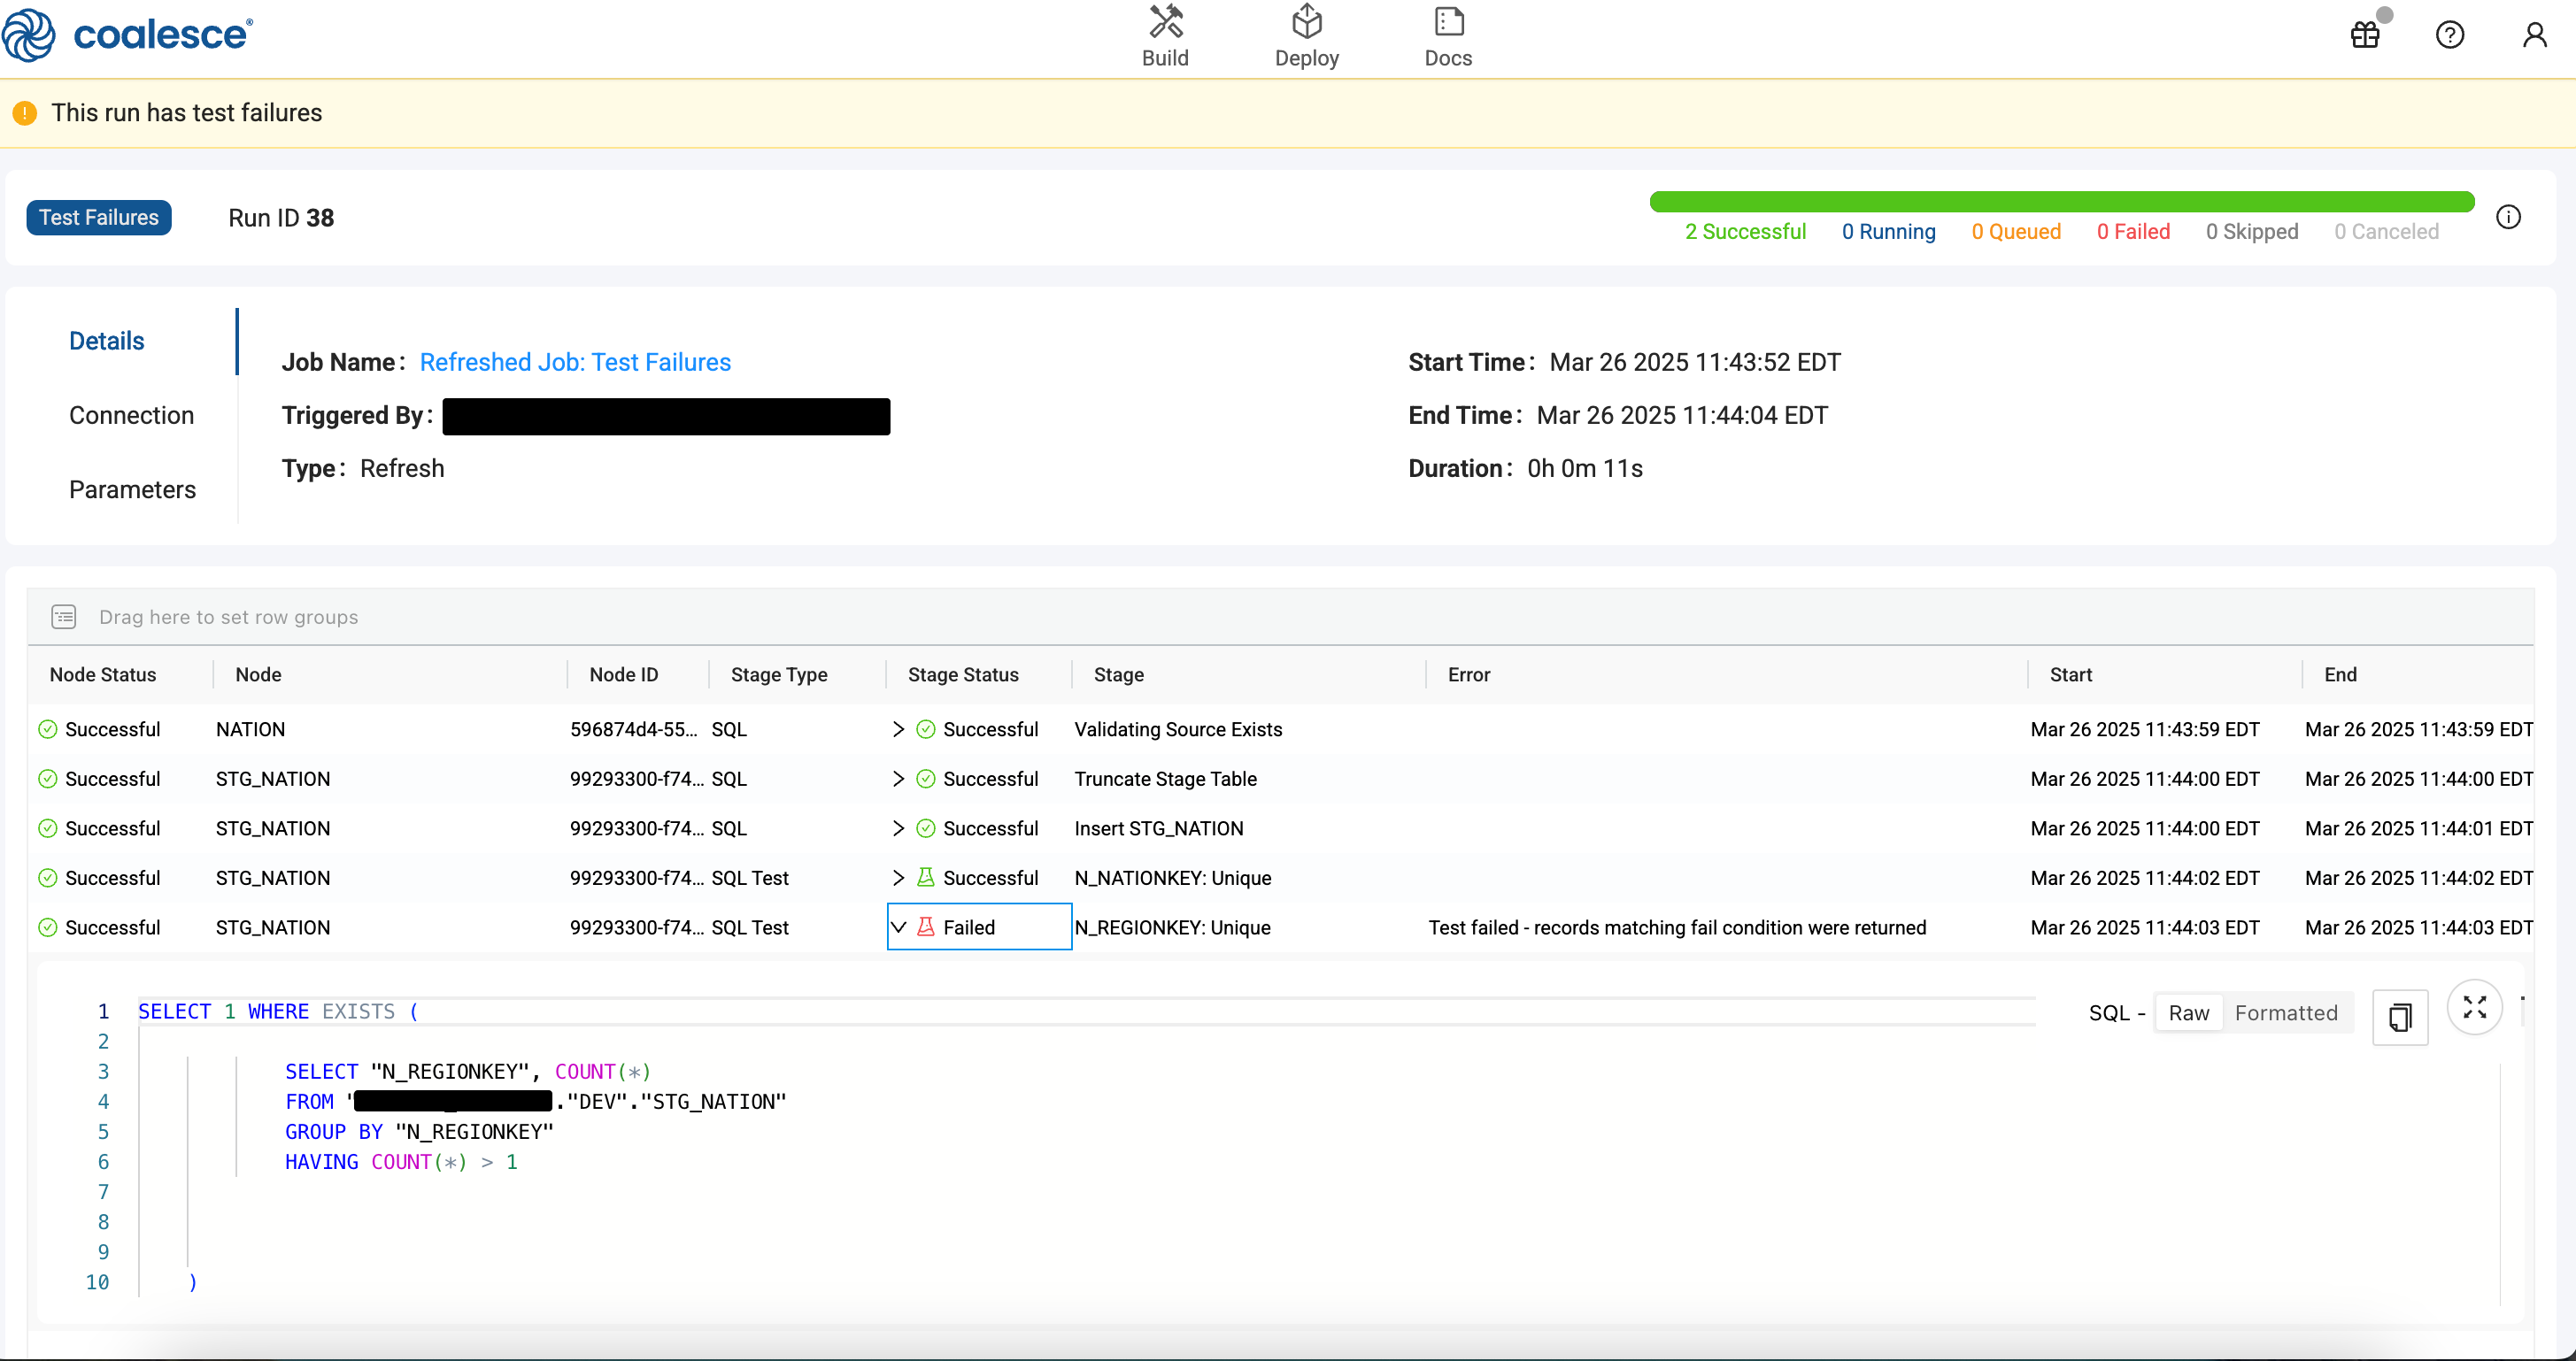
In the following example, the field hasTestFailure:true is present because a test failed. It failed on the test for "name": "N_REGIONKEY: Unique". You can look at the error to see what the failure was.
  "error": {
      "errorString": "Test failed - records matching fail condition were returned",
      "errorDetail": "Test failed - records matching fail condition were returned"
  },
The status will be success, while success will be false. This combination also indicates that while the refresh run finished, there was a failure and in this example, it was the column level test for unique.
  "status": "Success",
  "success": false,
{
    "data": [
        {
            "nodeID": "596874d4-5555-4114-9bdc-b2de778fd98c",
            "runState": "complete",
            "isRunning": false,
            "name": "NATION",
            "queryResults": [
                {
                    "endTime": "2025-03-26T15:44:27.156Z",
                    "isRunning": false,
                    "name": "Validating Source Exists",
                    "queryID": "01bb44d0-0907-dbe8-0012-7b031a5930e6",
                    "sql": "\nSELECT 1 FROM \"SNOWFLAKE_SAMPLE_DATA\".\"TPCH_SF100\".\"NATION\" LIMIT 0",
                    "startTime": "2025-03-26T15:44:26.920Z",
                    "status": "Success",
                    "success": true,
                    "warehouse": "COMPUTE_WH"
                }
            ]
        },
        {
            "nodeID": "99293300-f747-4990-a176-e82d2973694e",
            "runState": "complete",
            "hasTestFailures": true,
            "isRunning": false,
            "name": "STG_NATION",
            "queryResults": [
                {
                    "endTime": "2025-03-26T15:44:28.397Z",
                    "isRunning": false,
                    "name": "Truncate Stage Table",
                    "queryID": "01bb44d0-0907-d01f-0012-7b031a590a5e",
                    "sql": "\n\t\t\tTRUNCATE IF EXISTS \"TATIANA_GENERAL\".\"DEV\".\"STG_NATION\"\n\t\n\t\t\n\t\n\t\n\t\t\n\t\n\t\n\t\t\n\t\n\t\t\t\n\t\t\t\t\n",
                    "startTime": "2025-03-26T15:44:27.968Z",
                    "status": "Success",
                    "success": true,
                    "warehouse": "COMPUTE_WH"
                },
                {
                    "endTime": "2025-03-26T15:44:29.597Z",
                    "isRunning": false,
                    "name": "Insert STG_NATION",
                    "queryID": "01bb44d0-0907-dadd-0012-7b031a58fbee",
                    "rowsInserted": 25,
                    "sql": "\n\t\n\t\t\t\tINSERT INTO \"TATIANA_GENERAL\".\"DEV\".\"STG_NATION\"\n\t\t\t\t(\n\t\t\t\t\t\n\t\t\t\t\t\t\"N_NATIONKEY\",\n\t\t\t\t\t\n\t\t\t\t\t\t\"N_NAME\",\n\t\t\t\t\t\n\t\t\t\t\t\t\"N_REGIONKEY\",\n\t\t\t\t\t\n\t\t\t\t\t\t\"N_COMMENT\"\n\t\t\t\t\t\n\t\t\t\t)\n\t\t\t\n\t\n\t\t\tSELECT\n\t\t\t\n                \"NATION\".\"N_NATIONKEY\" AS \"N_NATIONKEY\", \n\t\t\t\n                \"NATION\".\"N_NAME\" AS \"N_NAME\", \n\t\t\t\n                \"NATION\".\"N_REGIONKEY\" AS \"N_REGIONKEY\", \n\t\t\t\n                \"NATION\".\"N_COMMENT\" AS \"N_COMMENT\"\n\t\t\t\n\t\n\t\t\tFROM \"SNOWFLAKE_SAMPLE_DATA\".\"TPCH_SF100\".\"NATION\" \"NATION\"\n\t\n\t\t\t\n\t\n\t\t\n\t\n\t\n\n\n\n\t\n\n\t\n\t\t\n\t\t\t\n",
                    "startTime": "2025-03-26T15:44:28.956Z",
                    "status": "Success",
                    "success": true,
                    "warehouse": "COMPUTE_WH"
                },
                {
                    "endTime": "2025-03-26T15:44:30.739Z",
                    "isRunning": false,
                    "name": "N_NATIONKEY: Unique",
                    "queryID": "01bb44d0-0907-dc64-0012-7b031a58cc06",
                    "sql": "SELECT 1 WHERE EXISTS (\n\t\t\t\n            SELECT \"N_NATIONKEY\", COUNT(*)\n            FROM \"TATIANA_GENERAL\".\"DEV\".\"STG_NATION\" \n            GROUP BY \"N_NATIONKEY\"\n            HAVING COUNT(*) > 1\n\t\t\n\t\n\t\t\n\t\n\t\t\n\t\t\t\n)",
                    "startTime": "2025-03-26T15:44:30.327Z",
                    "status": "Success",
                    "success": true,
                    "warehouse": "COMPUTE_WH"
                },
                {
                    "endTime": "2025-03-26T15:44:31.783Z",
                    "error": {
                        "errorString": "Test failed - records matching fail condition were returned",
                        "errorDetail": "Test failed - records matching fail condition were returned"
                    },
                    "isRunning": false,
                    "name": "N_REGIONKEY: Unique",
                    "queryID": "01bb44d0-0907-dbe8-0012-7b031a5930fa",
                    "sql": "SELECT 1 WHERE EXISTS (\n\t\t\t\n            SELECT \"N_REGIONKEY\", COUNT(*)\n            FROM \"TATIANA_GENERAL\".\"DEV\".\"STG_NATION\" \n            GROUP BY \"N_REGIONKEY\"\n            HAVING COUNT(*) > 1\n\t\t\n\t\n\t\t\n\t)",
                    "startTime": "2025-03-26T15:44:31.330Z",
                    "status": "Success",
                    "success": false,
                    "warehouse": "COMPUTE_WH"
                }
            ]
        }
    ]
}
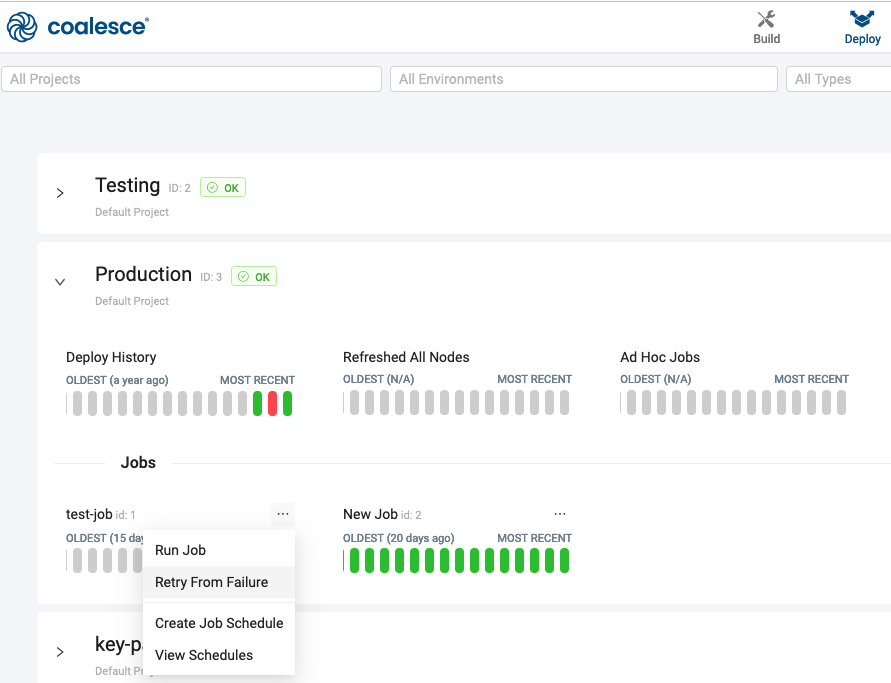
Retry From Failure
If a Job failed, you can retry the Job from the point of failure. You can use the:
- API - Use the Rerun a Job endpoint.
- Coalesce App - You can select the Job that failed and click Retry From Failure.
- Scheduler - You can configure scheduled Jobs to retry from beginning or from the point of failure.
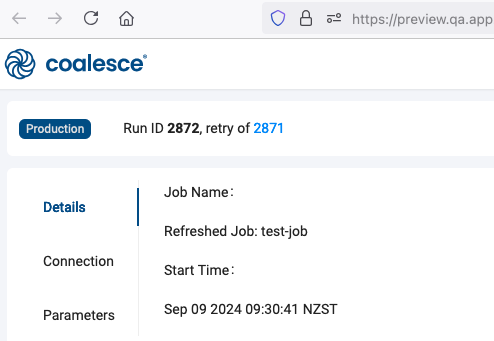
When you retry a Job from failure, in the Coalesce app, you'll be able to see the previous run details.
Rollback Your Deployment
You can redeploy the commit that was deployed just prior to the deployment you wish to rollback. Learn more in Rollback a Deployment.
Redeploy
You can edit your pipeline, commit the changes, and redeploy to fix any errors.