Documentation index: llms.txt. This page is also available as markdown: append .md to this URL or send Accept: text/markdown.
Trace Metrics and Dashboards in Catalog
What You Will Accomplish
Your operations VP sees Fare Revenue Per Mile drop on the NY Taxi Overview dashboard and asks whether the number is trustworthy or the definition changed. You do not own the pipeline, but you need an answer before the leadership review: what the metric officially means, which dashboard shows it, and which warehouse columns actually drive the calculation.
This guide walks that investigation in Catalog using a realistic discovery path. You will use Catalog to connect the report layer to governed definitions and source tables so you can explain or audit the metric with evidence.
By the end of this walkthrough you should be able to tell your stakeholder:
- The official definition of Fare Revenue Per Mile and any caveats your data team documented.
- Which dashboards in your BI tools surface that metric and who owns them.
- Which warehouse table and columns feed those dashboards, so engineering or analytics can validate the logic or refresh timing.
- Whether Knowledge, Mentioned in, Pinned Assets, and lineage in Catalog agree, or where documentation is missing.
Before You Begin
- Make sure you have access to Catalog.
- Confirm Dashboards and Data are populated. Empty lists mean an admin must finish warehouse and Data visualization integrations setup first.
Step 1: Confirm the Business Definition in Knowledge
Start with the metric name because executives usually cite the KPI label, not a table name.
-
In the left navigation, click Knowledge. Catalog opens the Knowledge hub at
/terms.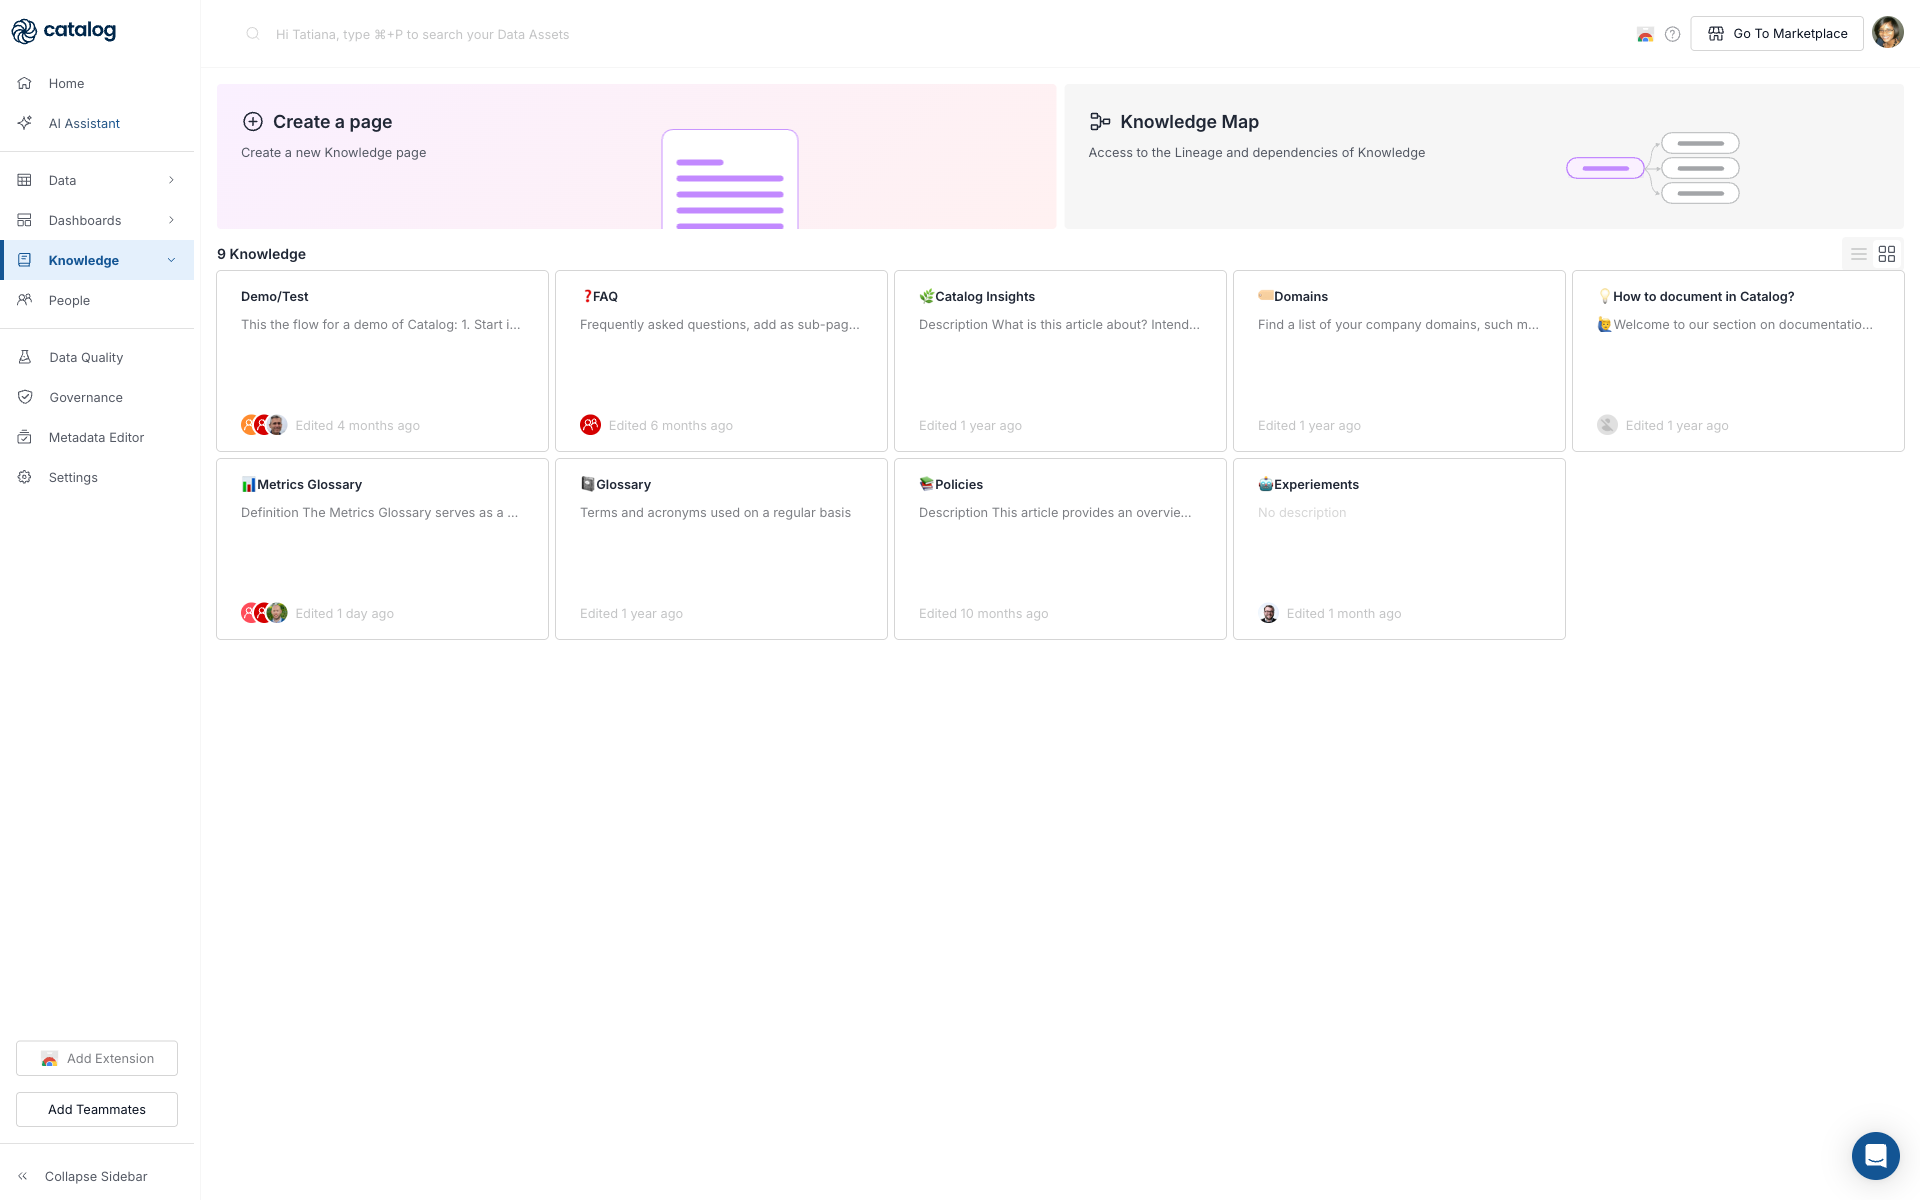
-
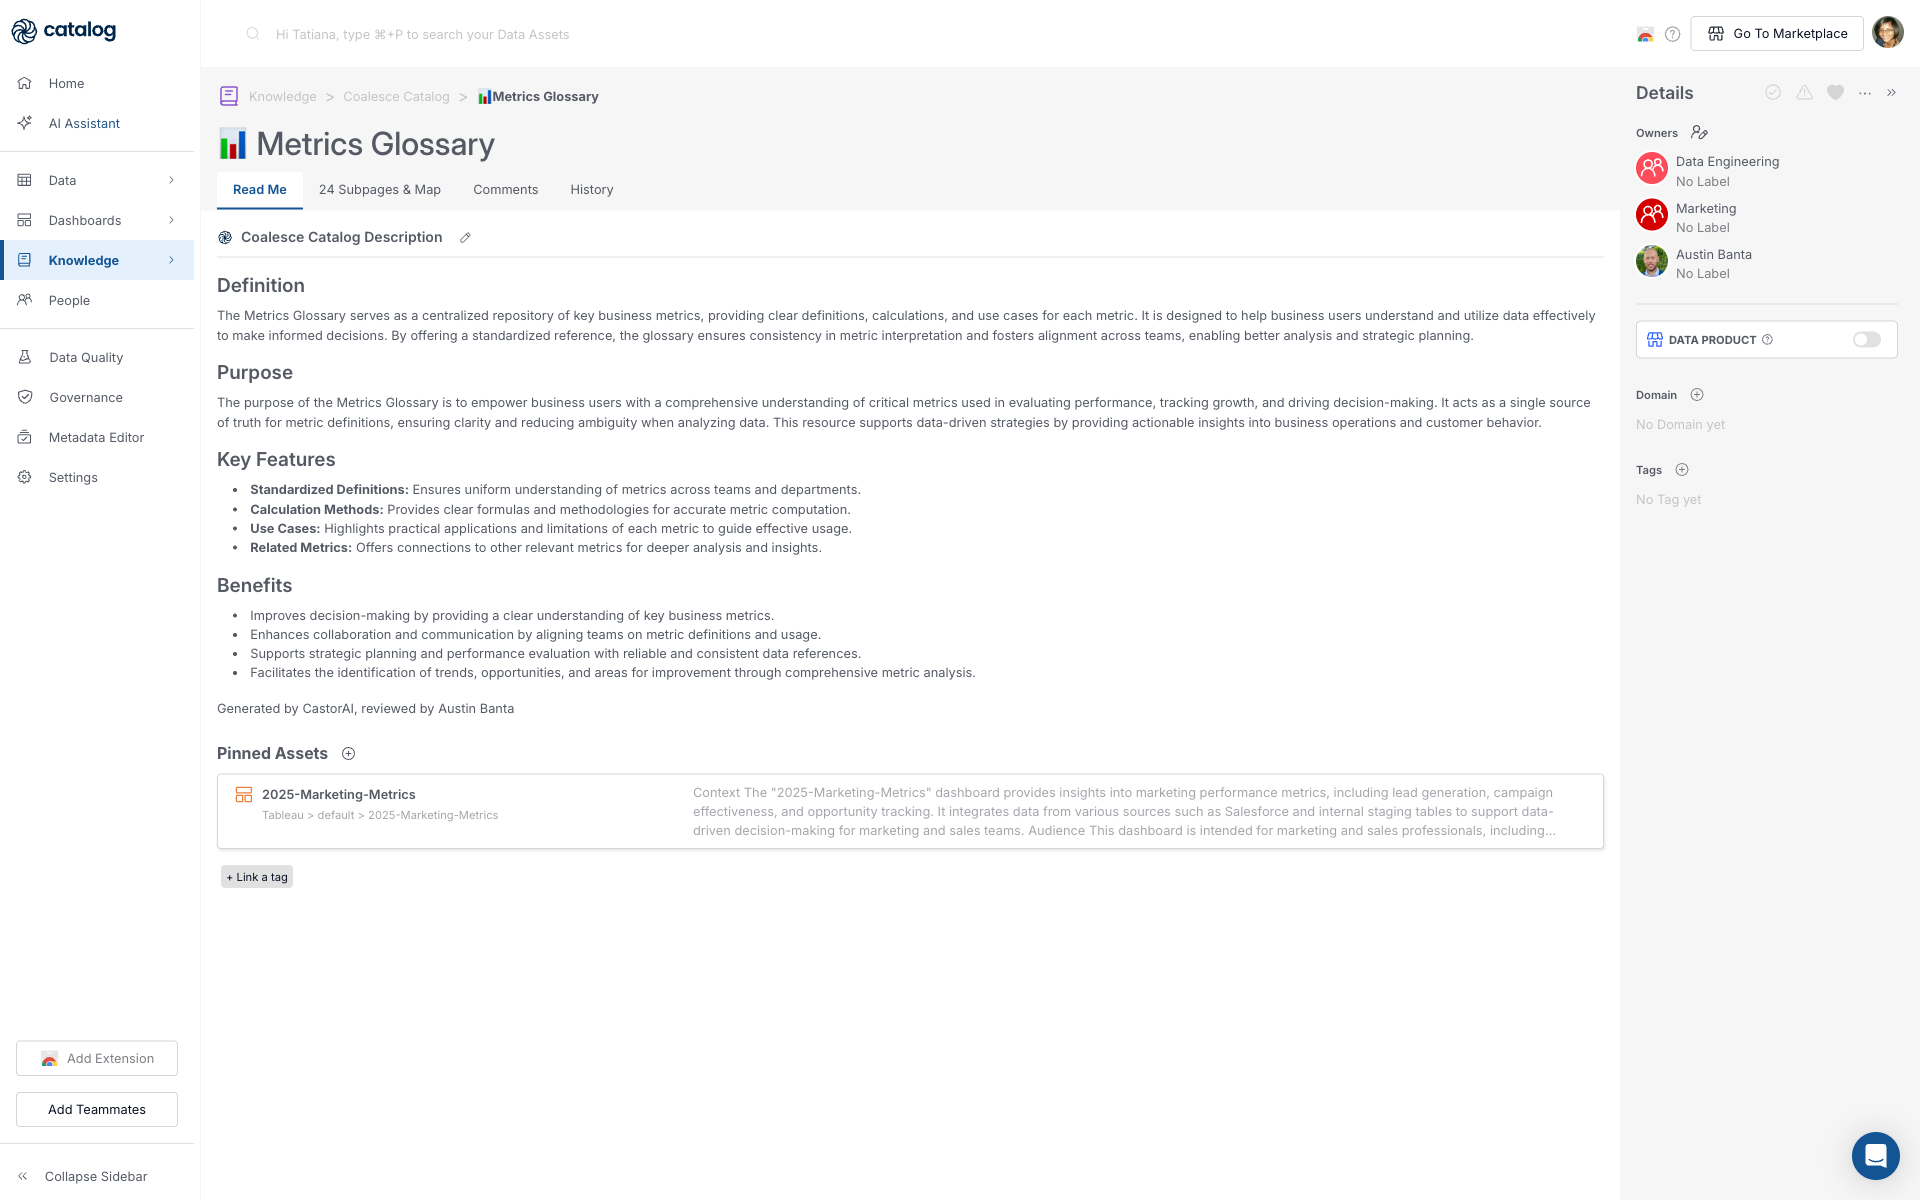
Open Metrics Glossary from the Knowledge hub.
-
Click the Subpages & Map tab. The label can include a count, for example 24 Subpages & Map or 0 Subpages & Map. In this example, look at Fare Revenue Per Mile.
-
On the Read me tab, review the steward-written description, Technical Definition, formula, and field notes for Fare Revenue Per Mile.
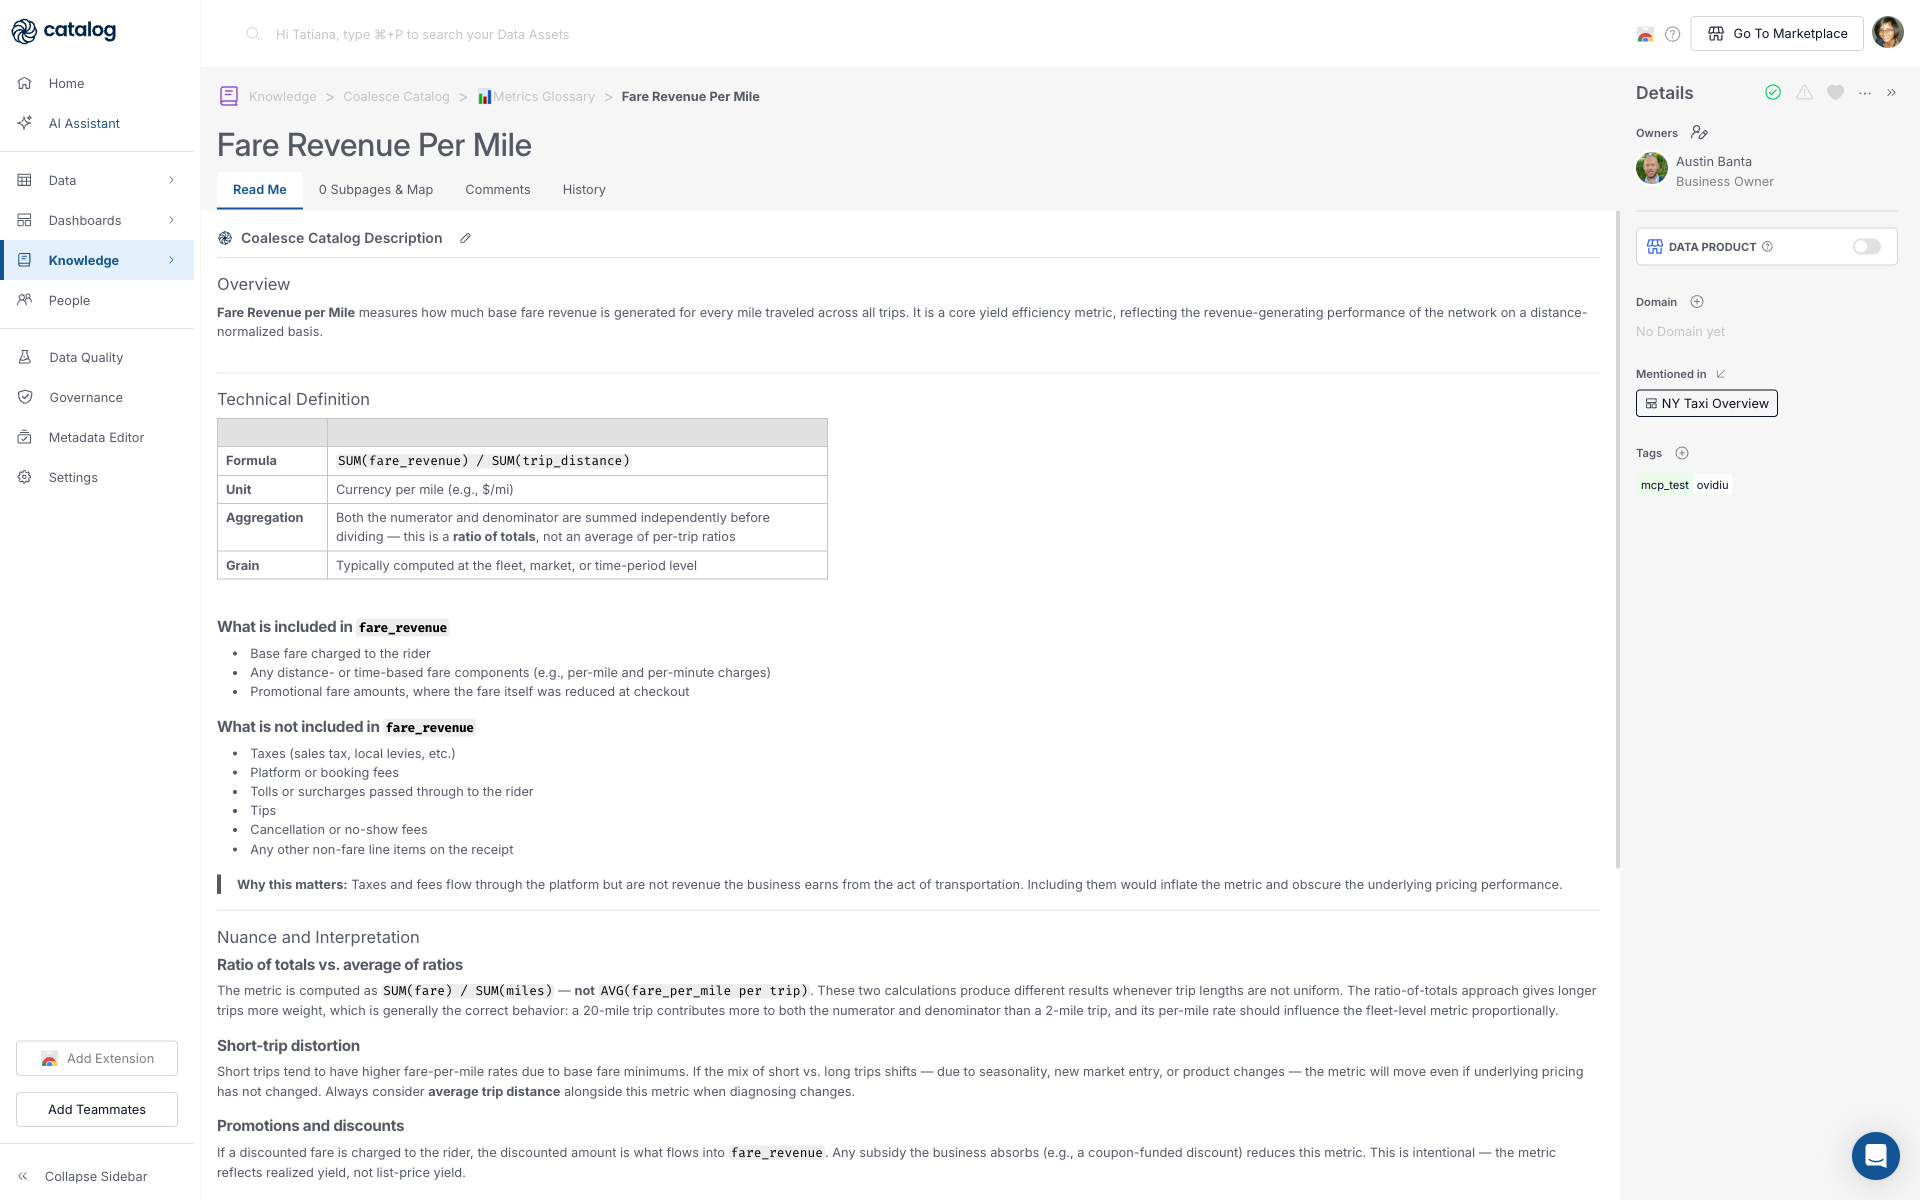
Fare Revenue Per Mile on the Read me tab: Technical Definition with SUM(fare_revenue) / SUM(trip_distance)and Mentioned in NY Taxi Overview in Details -
In the Details panel, review:
- Owners: Who to ping if the definition looks stale.
- Tags: How stewards classify the metric.
- Mentioned in: Other assets that reference the metric, for example NY Taxi Overview. Use these for cross-checks; they do not replace the formula on Read me. Stewards link the canonical dashboard from the metric side when the KPI is documented in Knowledge.
Checkpoint: You have a written definition and at least one linked dashboard. If Read me is empty and nothing is linked, record that gap. Your answer to the VP can be "definition not documented in Catalog yet" rather than guessing.
Step 2: Open the Dashboard That Reports the Metric
-
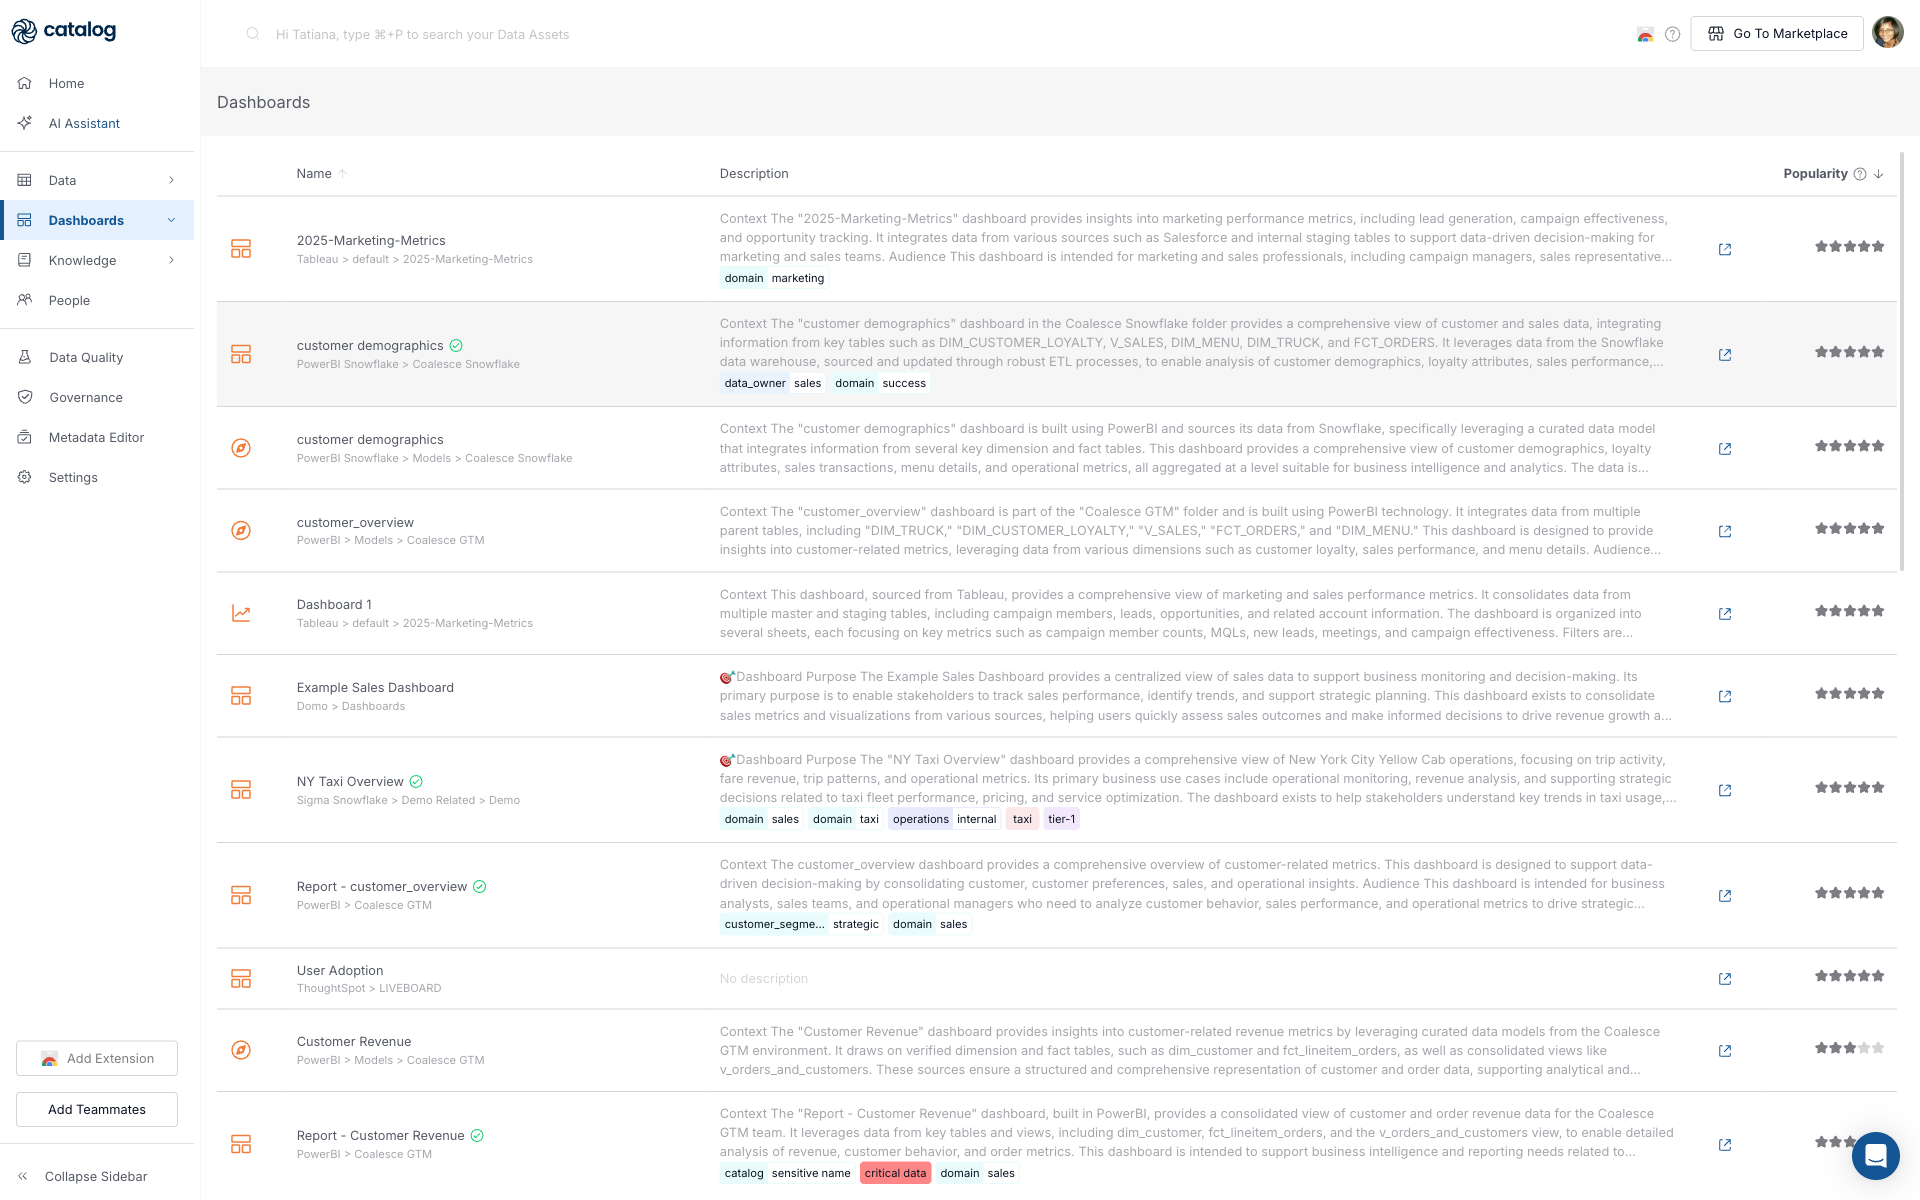
Click Dashboards.
-
You can either select the integration and folder for your metric or find it in the search bar.
-
Open the dashboard your stakeholder named. In this example it is NY Taxi Overview. Use the list search box if the folder tree is large.
-
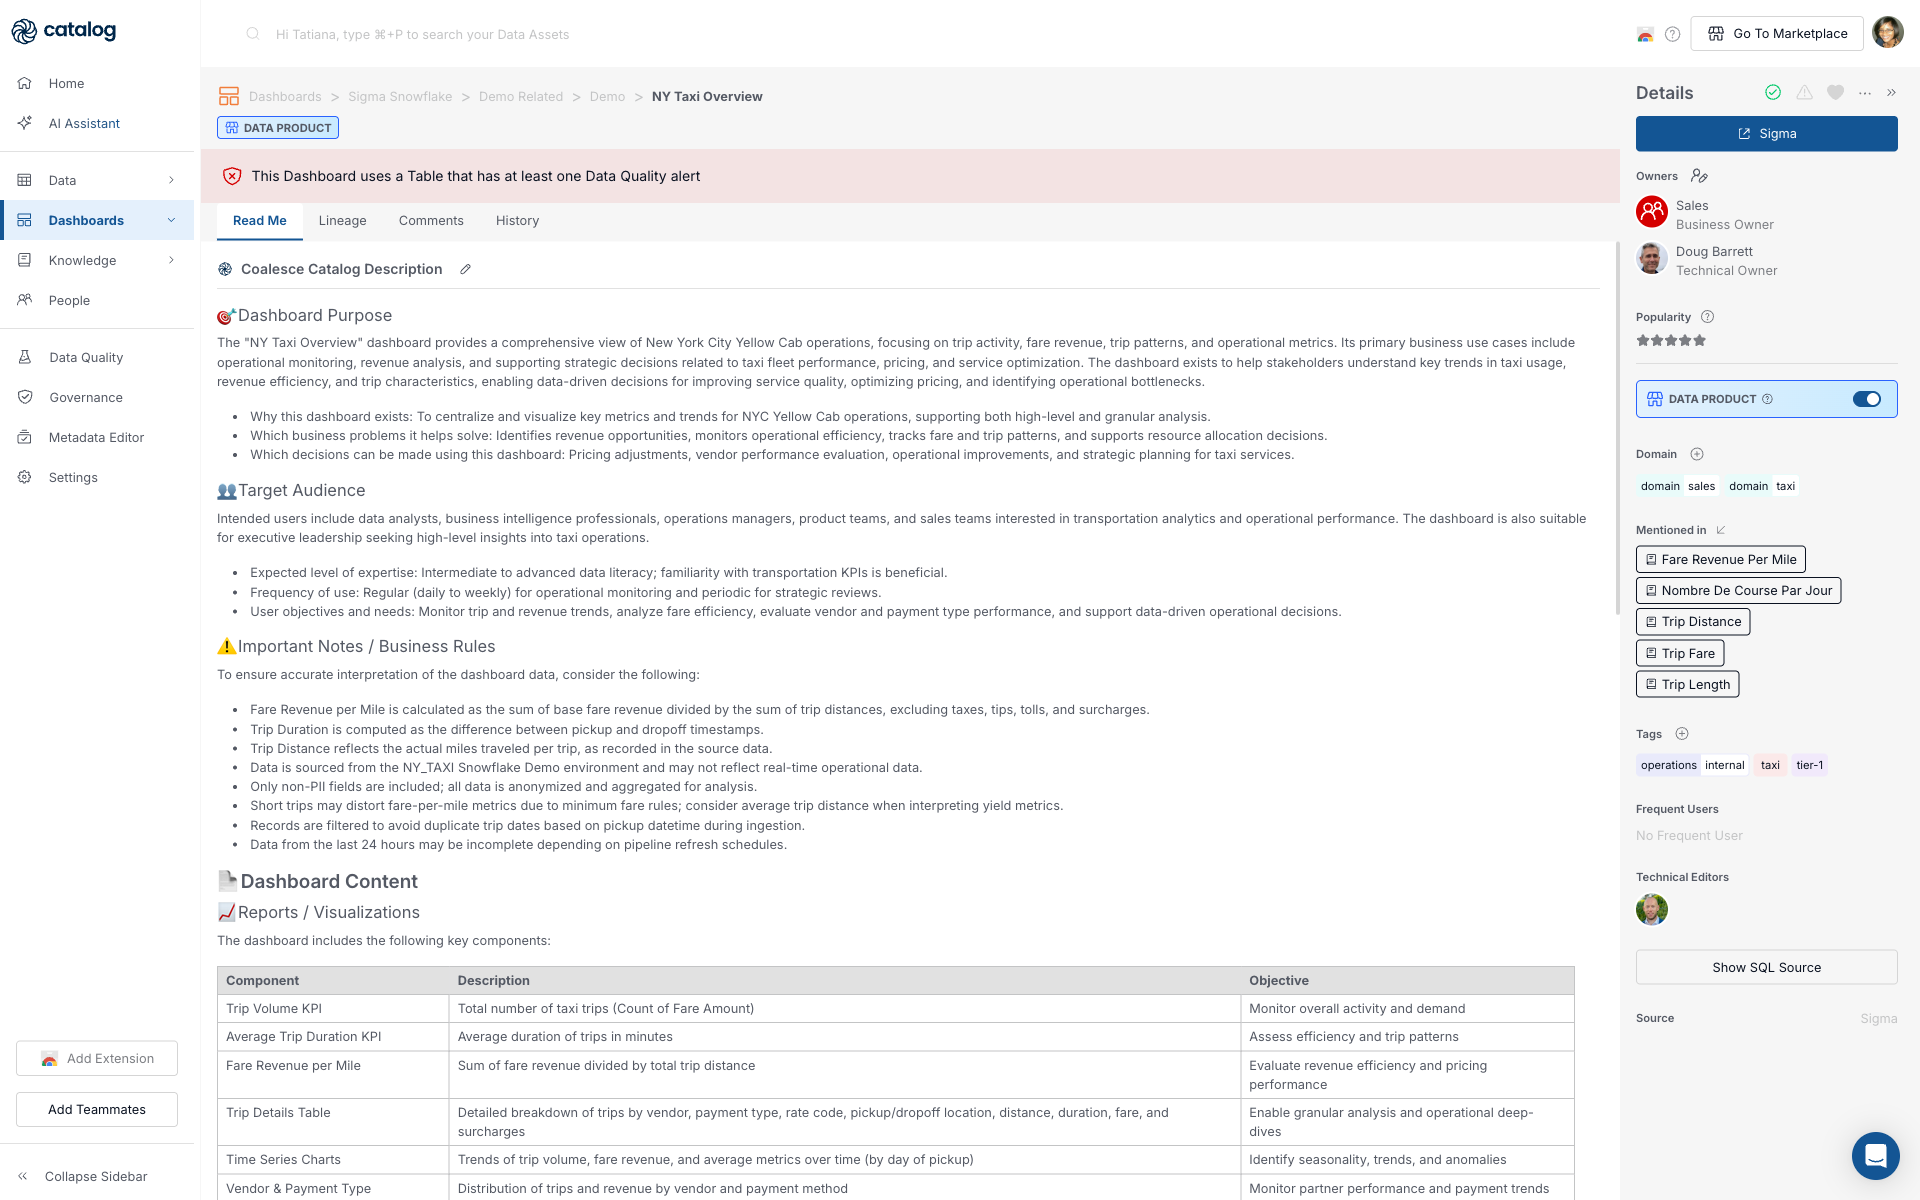
On the dashboard Read me tab, confirm the narrative matches what you read in Knowledge. For NY Taxi Overview, look for these sections:
- Audience: Target Audience lists who should use the dashboard, for example analysts, operations managers, and executive leadership, and how often they are expected to open it.
- Metric and tiles: Important Notes / Business Rules restates the Fare Revenue Per Mile formula (
SUM(fare_revenue) / SUM(trip_distance)), and Dashboard Content > Reports / Visualizations lists a Fare Revenue per Mile tile with its objective. Details > Mentioned in links back to the Knowledge metric for a cross-check.
-
Use Mentioned in to jump back to Fare Revenue Per Mile or related Knowledge pages if stewards linked them from the dashboard side.
-
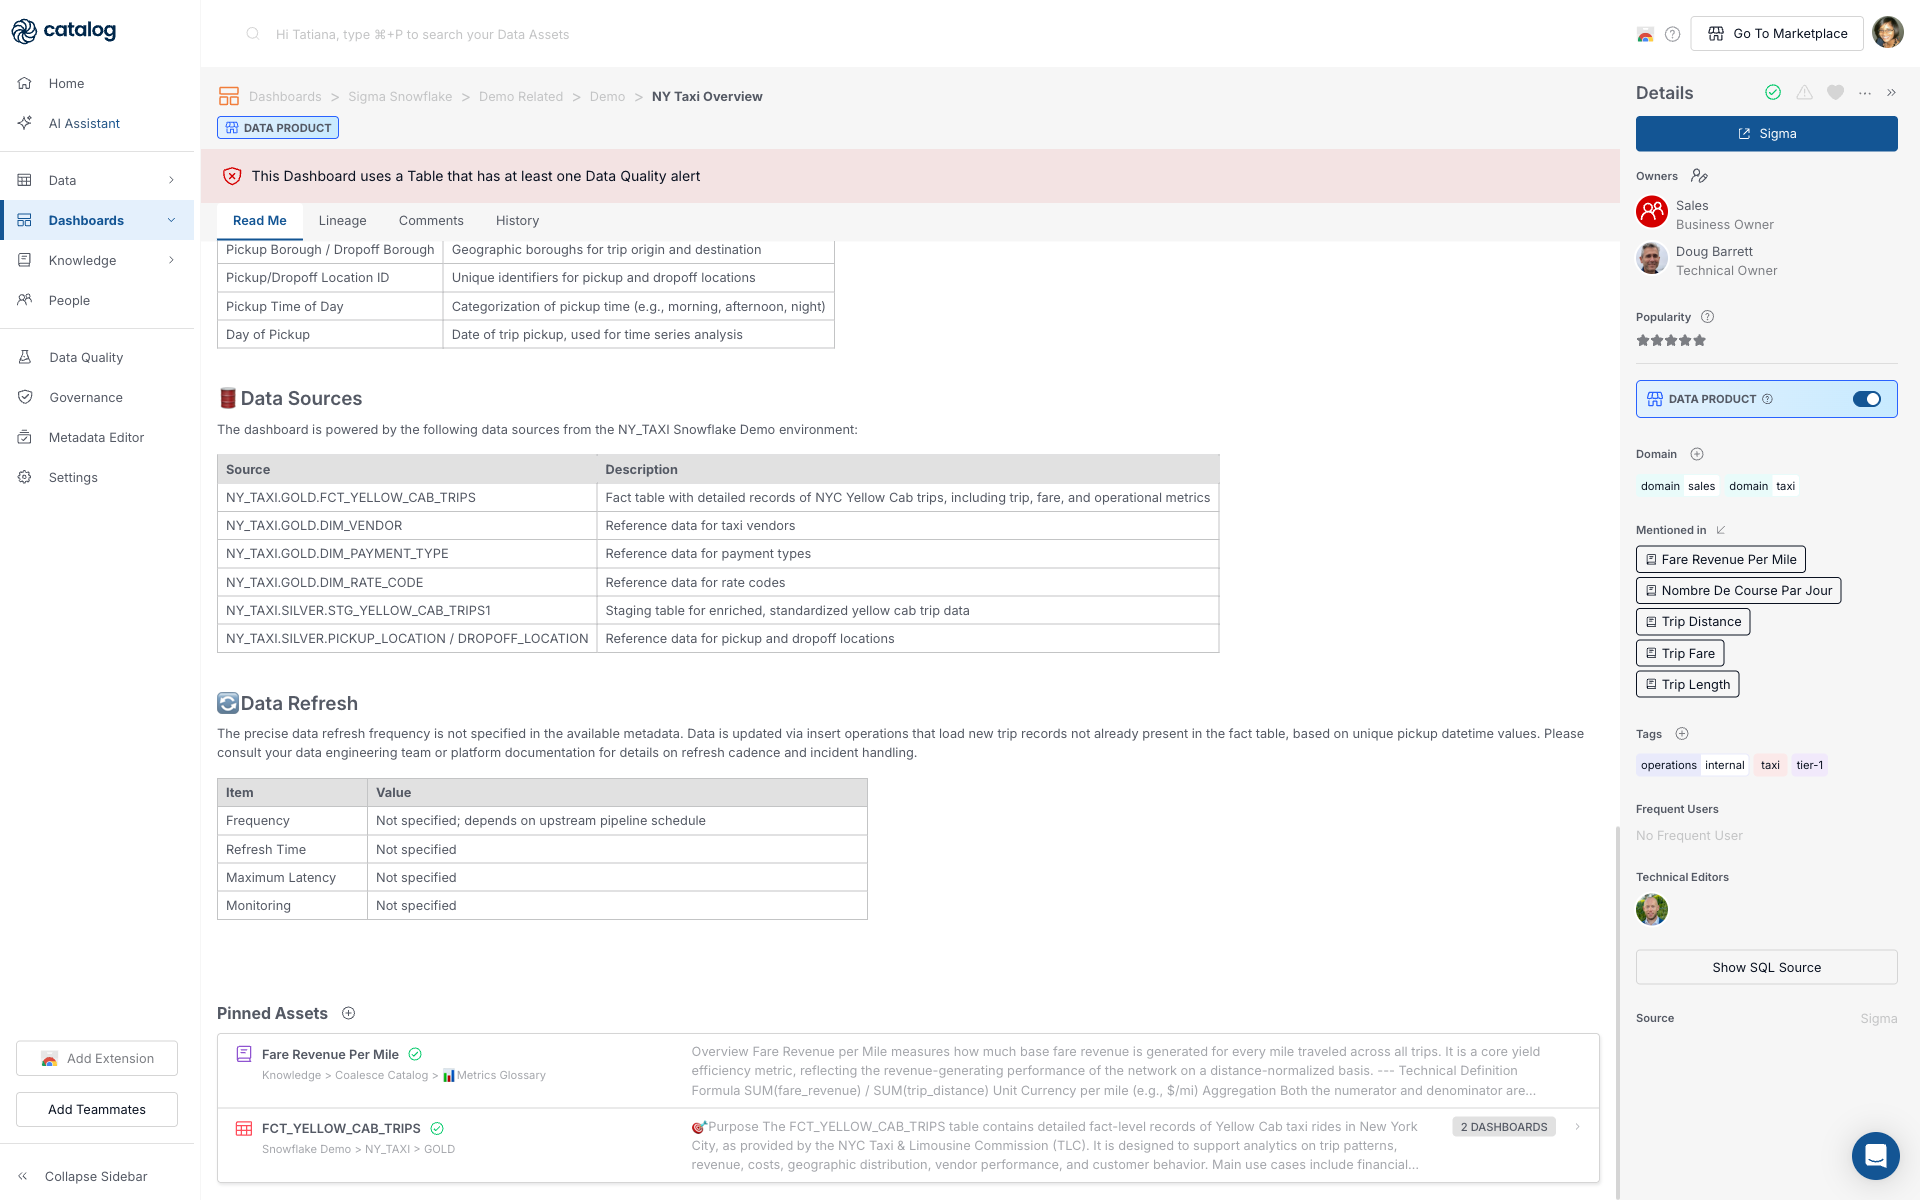
Scroll to Pinned Assets and Data Refresh on Read me when present. Data Refresh describes how often trip data is updated; if the schedule is not documented, note that gap before you answer the VP about whether stale data could explain the drop. In this example, stewards pinned FCT_YELLOW_CAB_TRIPS and Fare Revenue Per Mile, which gives you a shortcut to the warehouse table before you open lineage.
-
Check Popularity and Owners in Details. High popularity supports that this is the "official" view teams actually use, not an abandoned draft.
Checkpoint: You can name the dashboard, its owner, and whether its documentation aligns with the Knowledge definition. Misalignment here is a common root cause of "the number changed but the business meaning did not."
Step 3: Trace Lineage to Warehouse Tables
Connect the visible chart to physical data. Catalog shows upstream tables on the dashboard Lineage tab when BI extraction has populated dependency links.
-
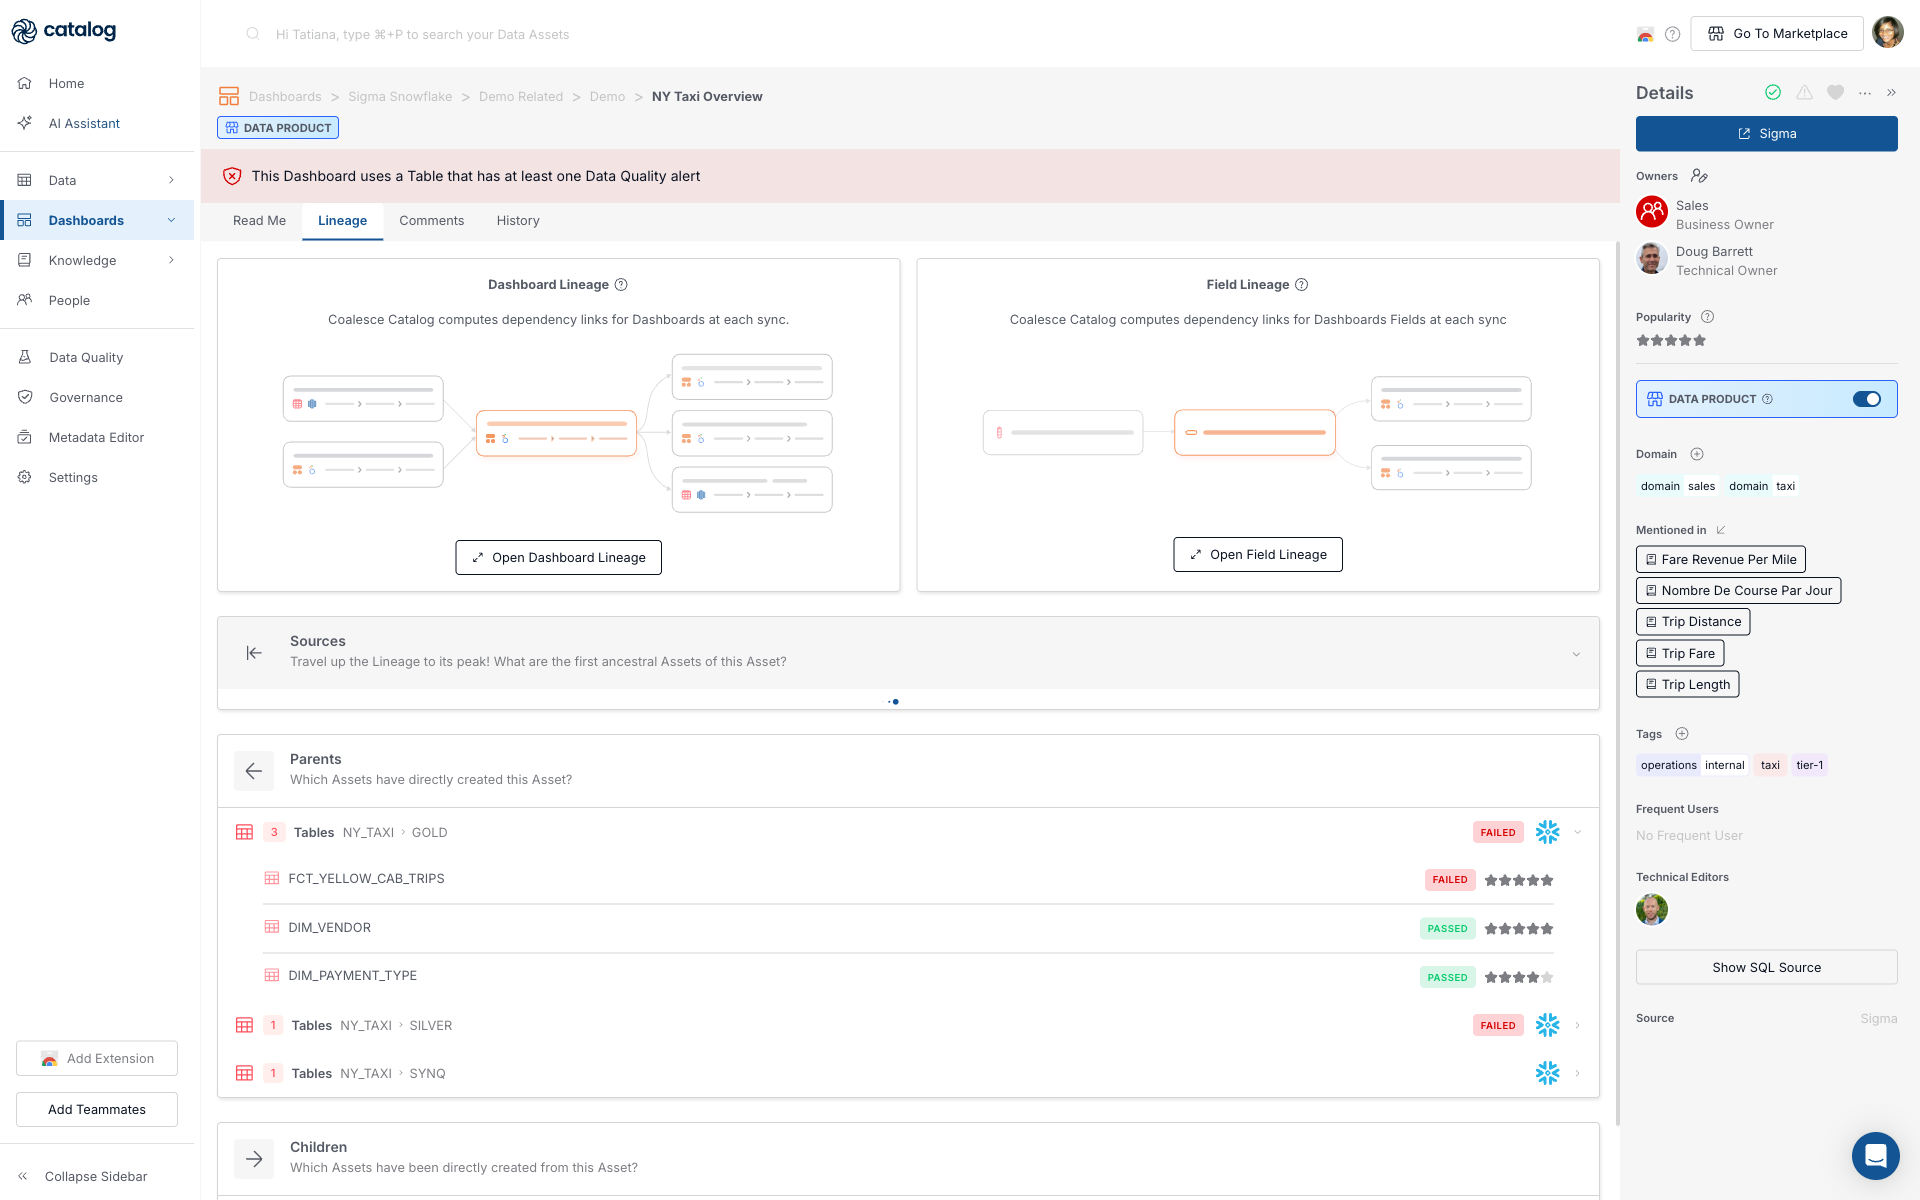
On NY Taxi Overview, open the Lineage tab.
-
Expand Parents first, then open Sources and Children when you need the full upstream or downstream chain. Each section answers a different question about how this dashboard connects to warehouse data:
- Sources travels to the first ancestral assets in the chain. You see the earliest upstream tables Catalog found, often grouped by schema layers such as NY_TAXI > GOLD, SILVER, and SYNQ. Use Sources when you need the full upstream path beyond the tables Sigma queries directly.
- Parents lists assets that directly feed the dashboard. For NY Taxi Overview, expect FCT_YELLOW_CAB_TRIPS, DIM_VENDOR, and DIM_PAYMENT_TYPE under NY_TAXI > GOLD. The fact table holds trip fare and distance fields that implement Fare Revenue Per Mile; the dimension tables add vendor and payment context to other tiles. Check FAILED or PASSED badges here when a stakeholder asks whether the dashboard number is trustworthy.
- Children lists assets built from this dashboard. Dashboards are usually leaf assets in Catalog, so NY Taxi Overview often shows no children. An empty Children list confirms nothing else in Catalog depends on this dashboard.
-
Optional: click Open Dashboard Lineage or Open Field Lineage when you need the full graph view or column-level upstream paths.
Checkpoint: You can name at least one warehouse table on the lineage path from dashboard to source when lineage is populated. In this demo, that table is FCT_YELLOW_CAB_TRIPS at Data > Snowflake Demo > NY_TAXI > GOLD, reached from dashboard Lineage > Parents. If lineage is empty, your checkpoint is a recorded gap plus the dashboard and Knowledge links you already collected.
Step 4: Find the Column That Drives the Metric
Tables can expose dozens of fields. Narrow to the columns that implement the KPI.
-
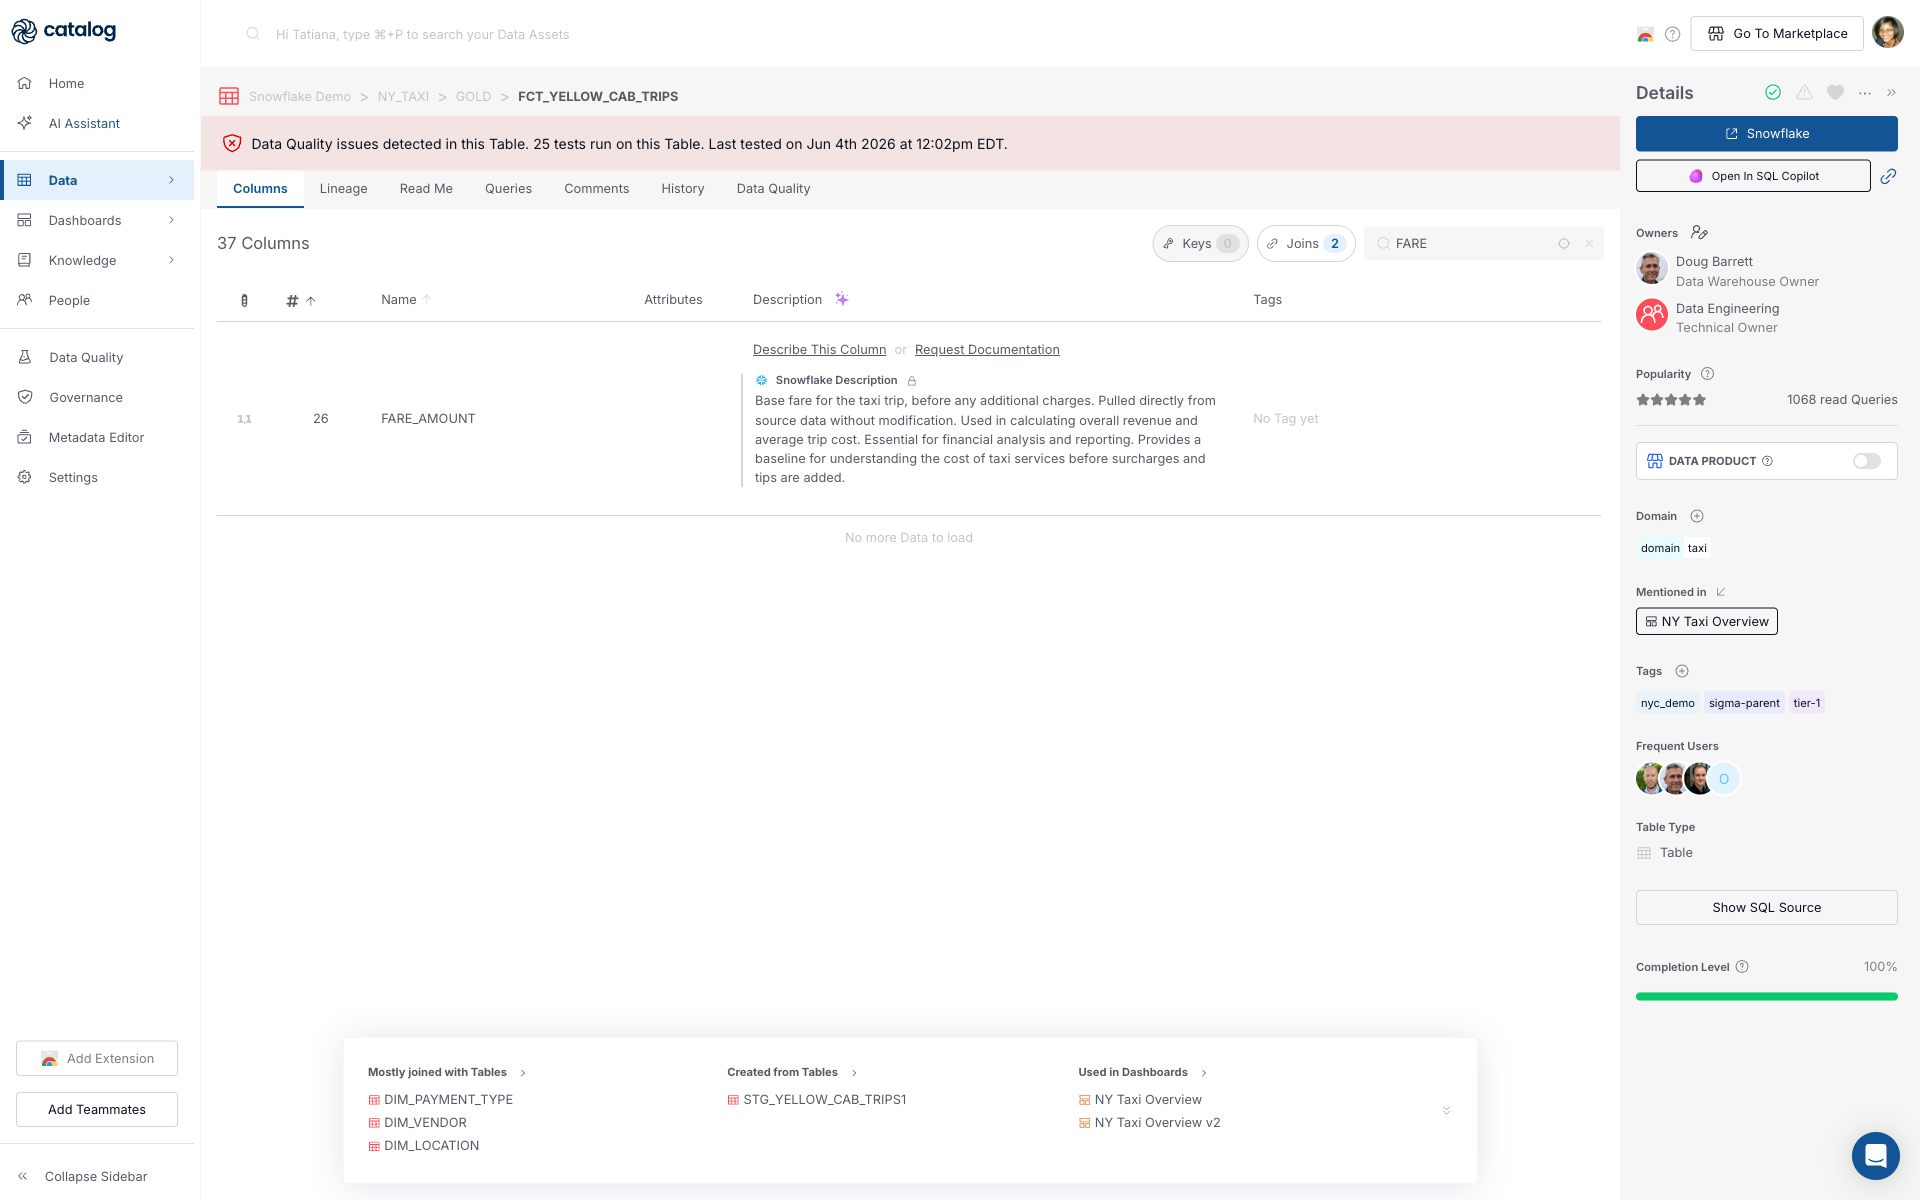
From dashboard Lineage > Parents, click FCT_YELLOW_CAB_TRIPS at NY_TAXI > GOLD, then open the Columns tab.
-
In Search Column name, filter for terms from the Knowledge formula. Search one term at a time. For example, type
FAREto locate FARE_AMOUNT, thenTRIPfor TRIP_DISTANCE. Both map to the metric definitionSUM(fare_revenue) / SUM(trip_distance).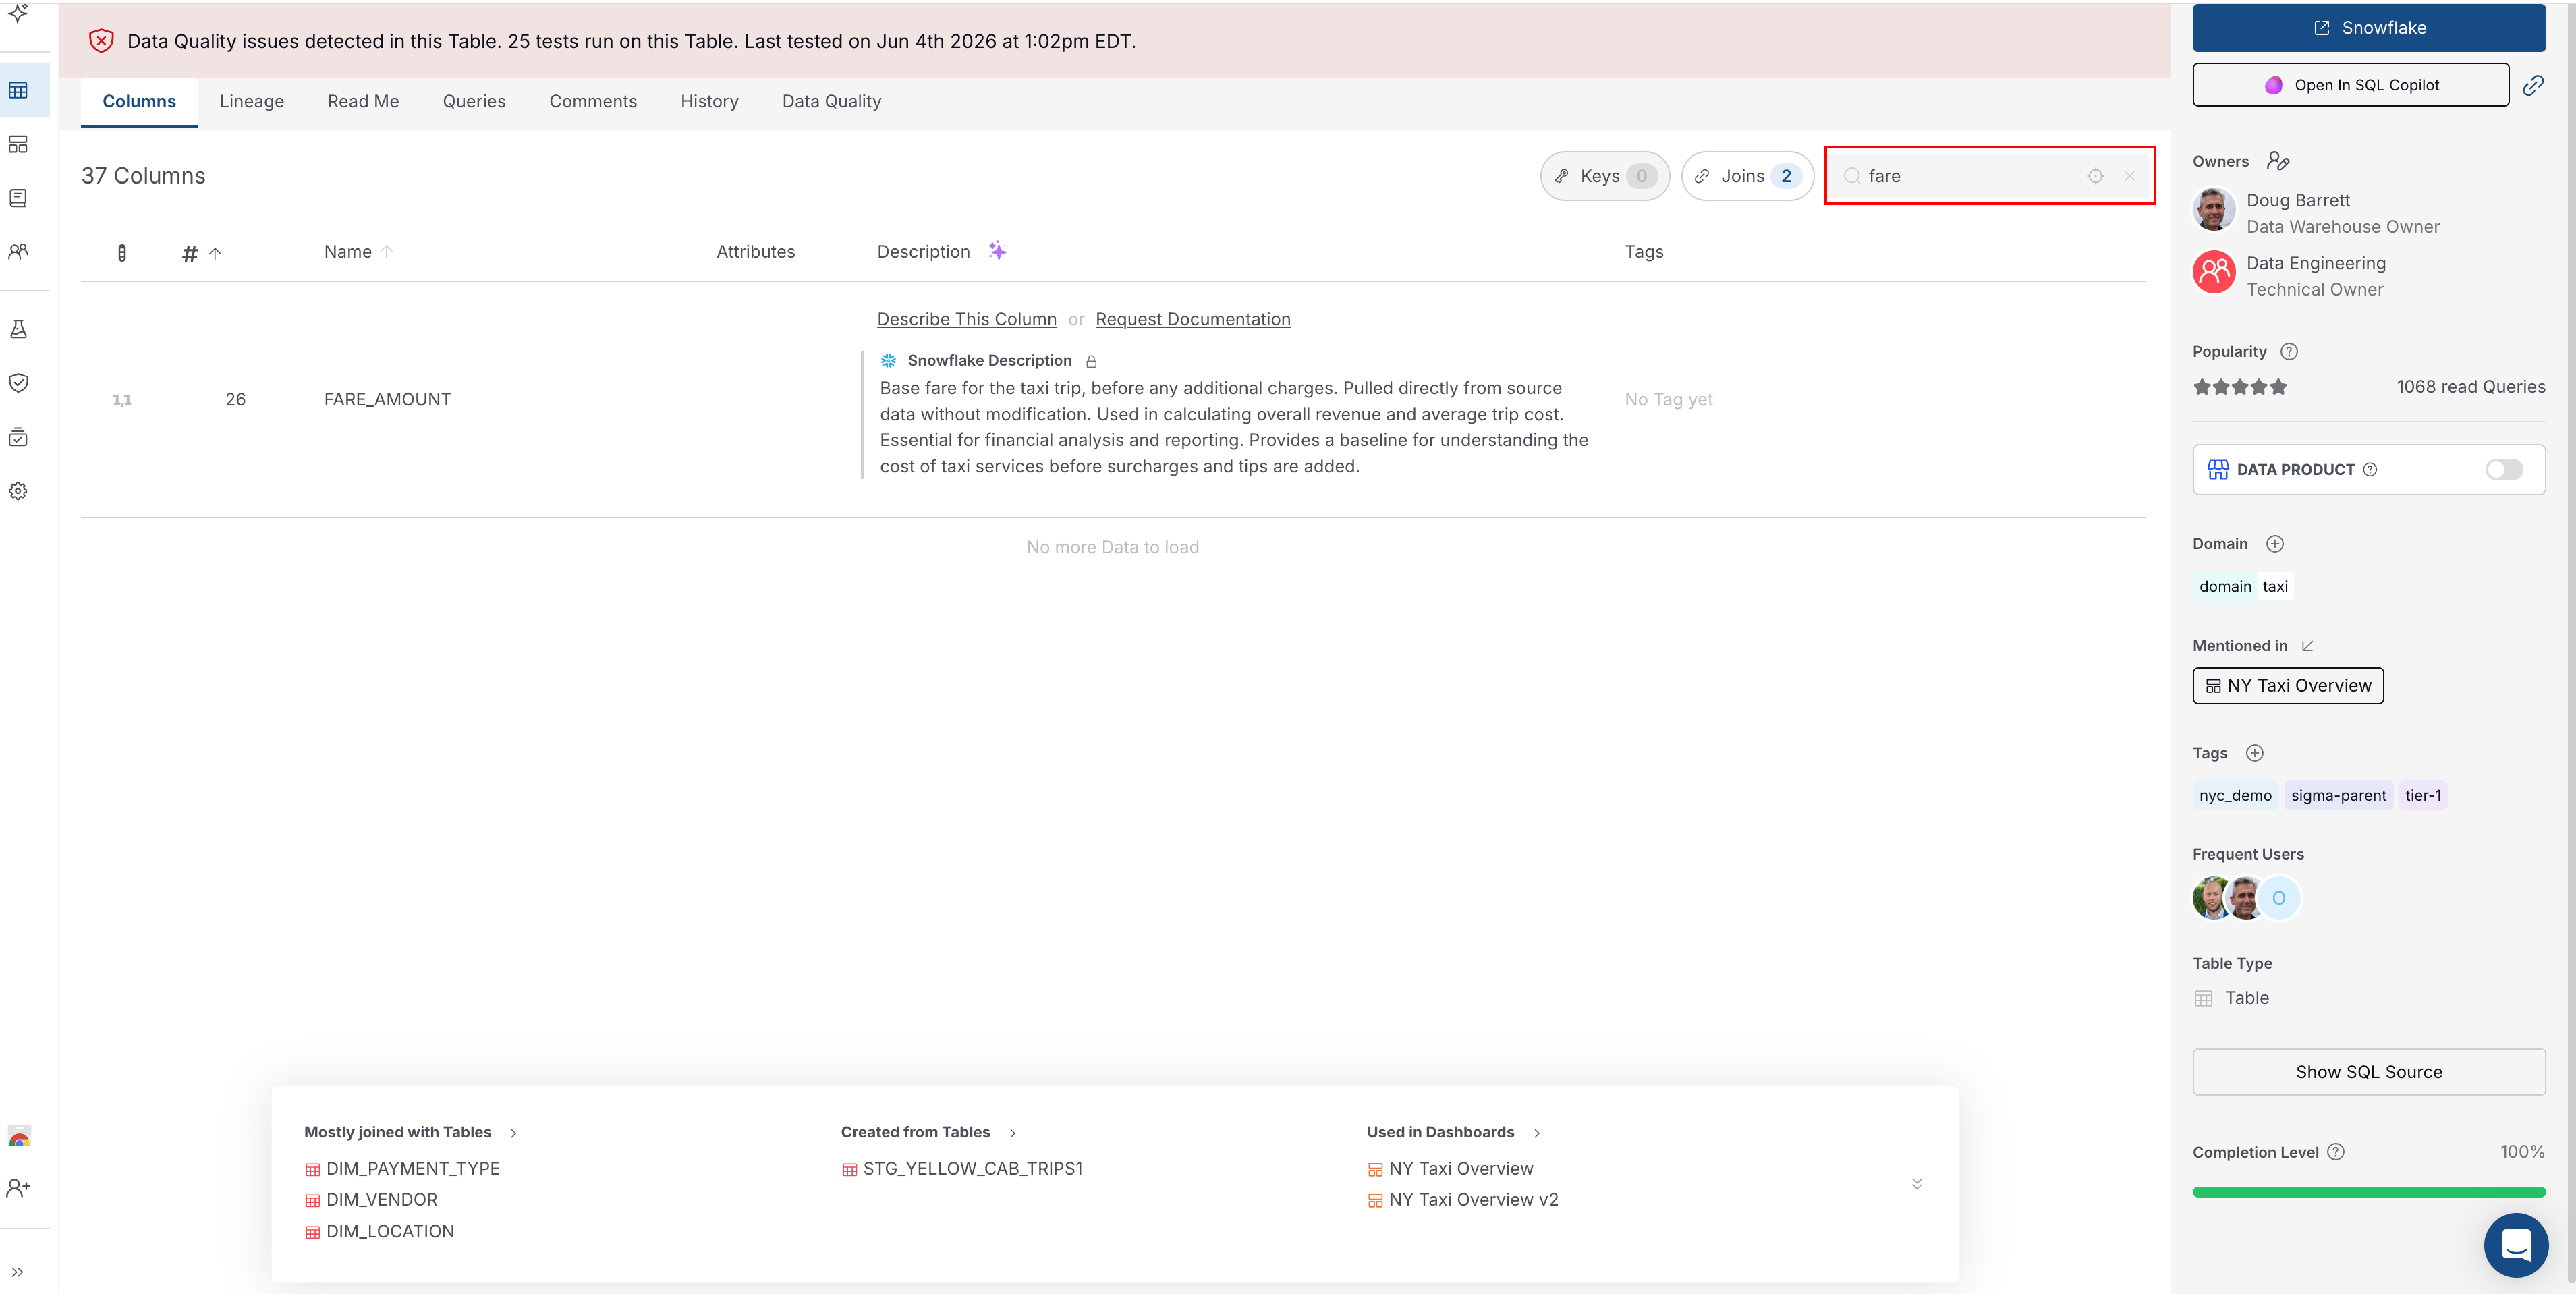
-
Confirm the columns you found feed the dashboard your stakeholder asked about. Scroll to Used in Dashboards at the bottom of the Columns tab. In this example, NY Taxi Overview is listed there, which ties FARE_AMOUNT and TRIP_DISTANCE on FCT_YELLOW_CAB_TRIPS to the view the VP is questioning. That is the handoff data engineering needs: concrete
table.columnnames on the table the dashboard reads. -
For column-level lineage, click Open Field Lineage on the Lineage tab.
-
Open the table Read me tab for table-level context and any Pinned Assets that point back to Fare Revenue Per Mile or sibling metrics.
Checkpoint: You can state concrete columns to validate in SQL or with the pipeline owner, for example FCT_YELLOW_CAB_TRIPS.FARE_AMOUNT and FCT_YELLOW_CAB_TRIPS.TRIP_DISTANCE. That is the artifact data engineering needs, not only "the taxi dashboard looks wrong."
Step 5: Synthesize Your Answer
Bring the checkpoints together into a short narrative you can send or present:
| Question from your stakeholder | Where you found it in Catalog |
|---|---|
| What is Fare Revenue Per Mile supposed to mean? | Knowledge metric page > Read me |
| Which dashboard are they looking at? | Dashboards detail page or Knowledge Mentioned in |
| Who maintains that dashboard? | Dashboard Details > Owners |
| Which table holds the source data? | Dashboard Lineage > Parents |
| Which columns should we audit? | Table Columns, Open Field Lineage, or Used in Dashboards |
| Is documentation complete? | Empty Read me, missing links, or broken lineage |
Example reply you can adapt:
Fare Revenue Per Mile is defined in Knowledge as
SUM(fare_revenue) / SUM(trip_distance)with field notes on what counts in fare revenue. The VP is looking at NY Taxi Overview, owned by the names listed under Details > Owners. The dashboard reads FCT_YELLOW_CAB_TRIPS; audit FARE_AMOUNT and TRIP_DISTANCE there. Knowledge, dashboard Read me, Pinned Assets, and Parents lineage agree in our workspace. Data Refresh is documented or missing, so note whether stale data could explain the drop before you commit to an answer.
Other Ways to Start the Same Investigation
This example began with Knowledge because the VP cited the Fare Revenue Per Mile metric name. The same outcome is reachable from other entry points:
| If you already know… | Start here |
|---|---|
| Dashboard title only | Dashboards |
| Table or column name | Data browse or Advanced Search in this guide |
| Only a vague question | AI Assistant section |
Search When You Have a Fragment of a Name
Use these paths when you know part of an asset name but not the full Catalog URL. Each subsection picks up the main investigation at the step shown in the table in this section.
From Home
-
Open Home in the left navigation, or go to
/search. -
Type a metric, dashboard, or table name in the search field. The placeholder reads "Search anything in the Coalesce Catalog".
-
Click Search to run the query. Matches stay on Home; open an asset from the list to continue the investigation at Step 2 or Step 3 in the table above. Do not use Search when you need the filtered
/resultspage; use Advanced Search in this guide instead.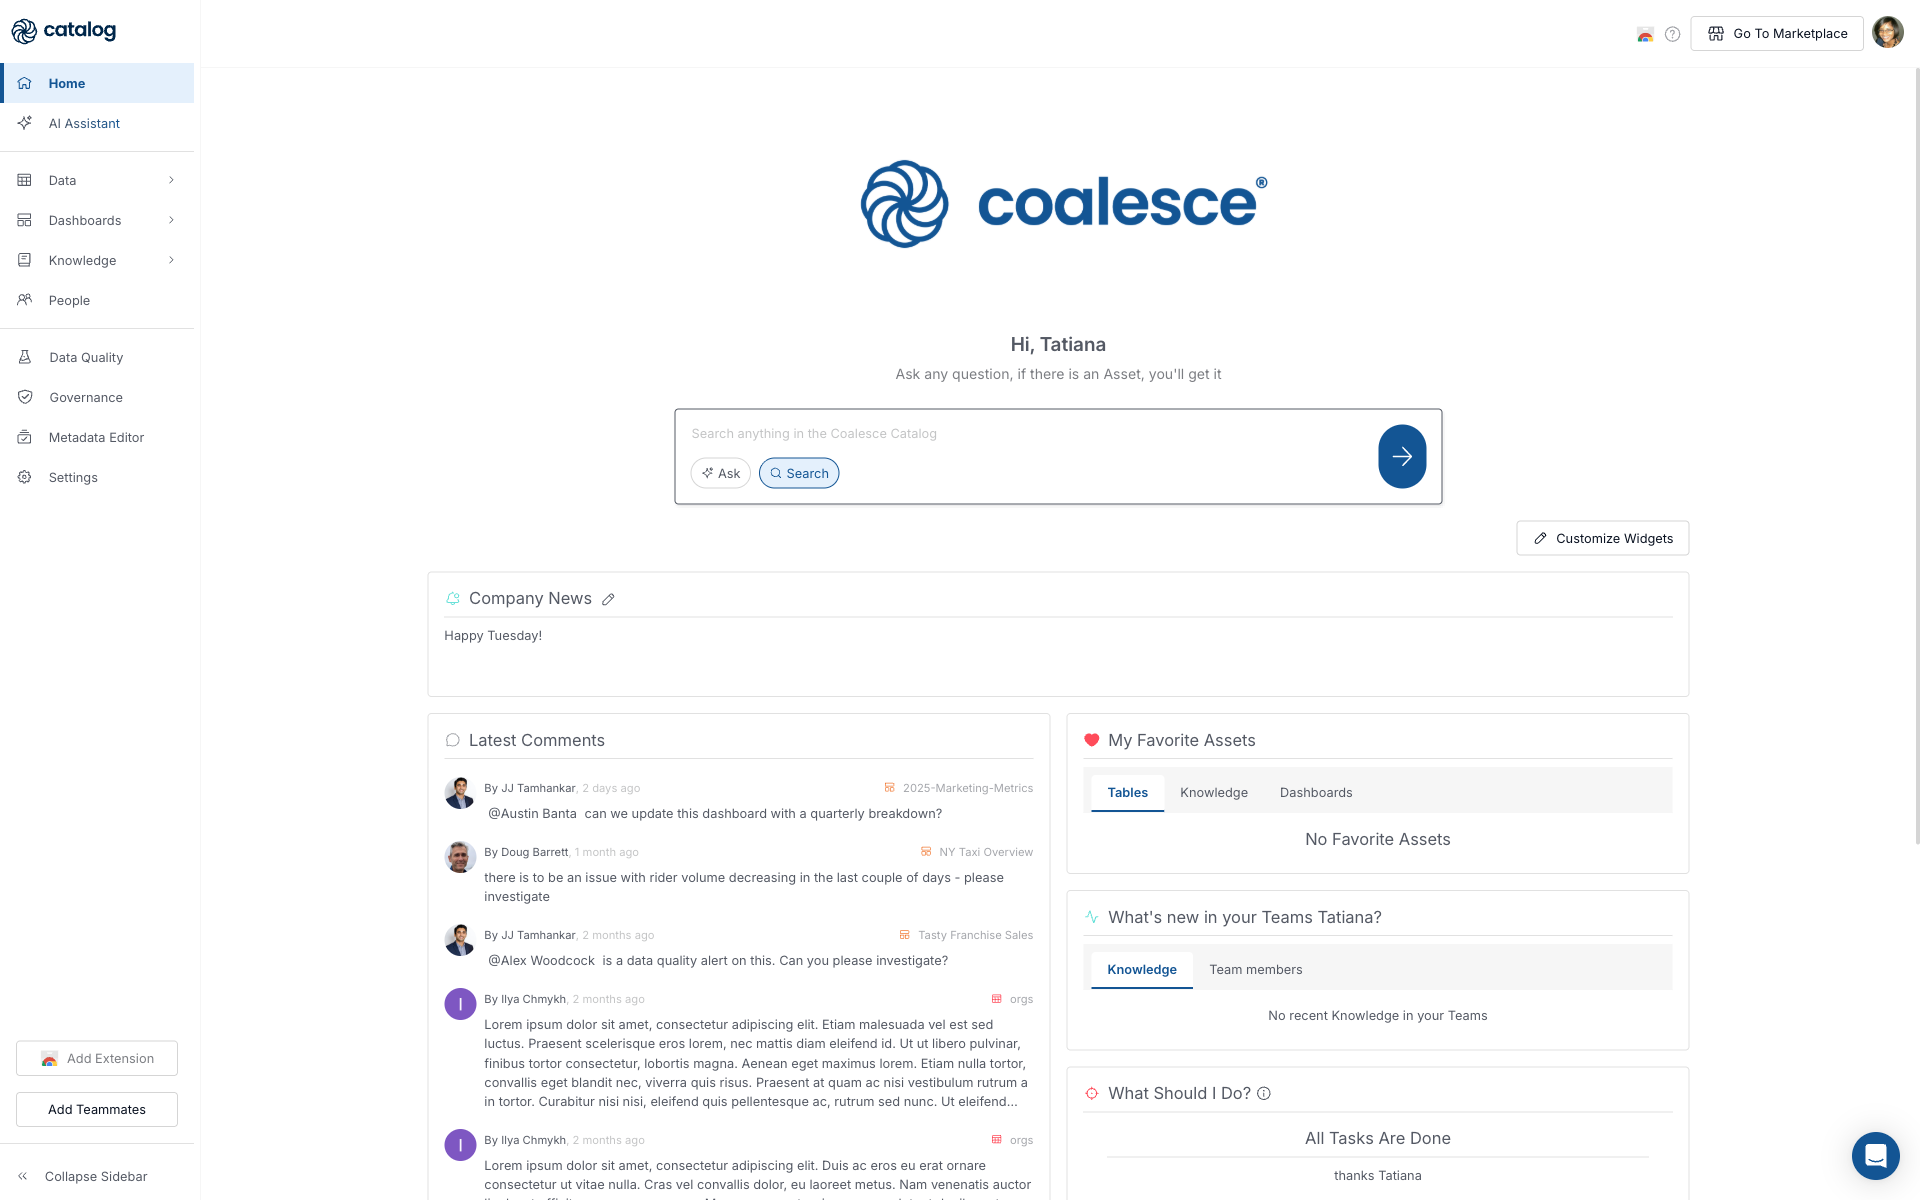
Advanced Search
Use this when you need filters for asset type, owner, certification, tags, and related options rather than only top matches on Home. See Advanced Search for how each filter behaves.
-
On Home, type a metric, dashboard, or table name in the search field, same as From Home step 2.
-
Press Enter (not Search) to open the Search results page at
/resultswith a Filters panel on the right.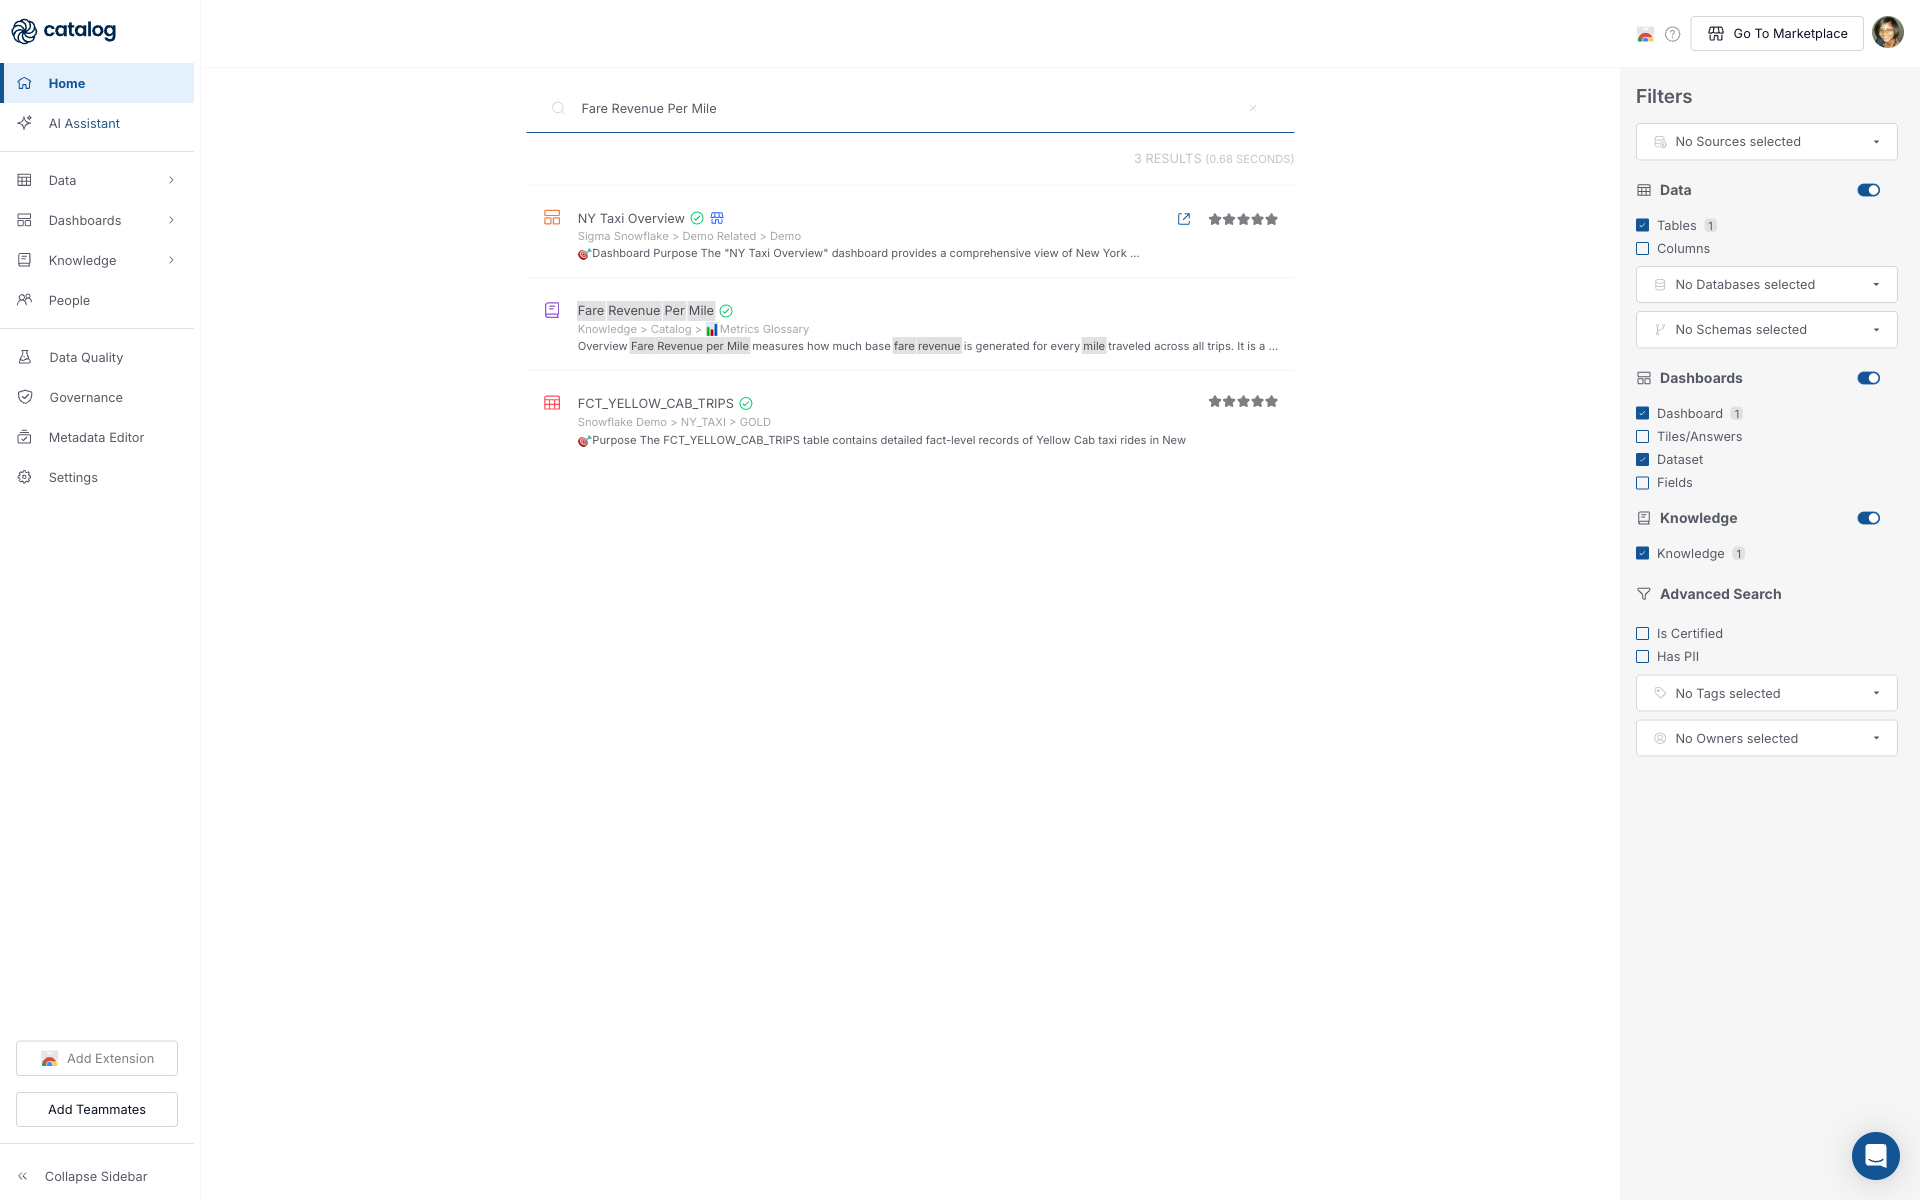
-
Adjust Filters for Dashboards, Knowledge, Tables, is Certified, Owner, Tags, and other options your workspace exposes.
-
Open the best match and continue from Step 2 or Step 3 in the table in this section.
Browse Data
Use this when you know the warehouse object path but not the exact Catalog URL.
- In the left navigation, click Data.
- Expand the warehouse, database, and schema, for example Snowflake Demo > NY_TAXI > GOLD, then open the table your team uses for the metric.
- Continue at Step 4, Find the Column That Drives the Metric.
When you are already on a table or dashboard page, the top search field is scoped to data assets. Its placeholder shows ⌘ + P on Mac or Ctrl + P on Windows for that in-context search.
For a full map of discovery methods, see Data discovery.
Optional: Use AI Assistant
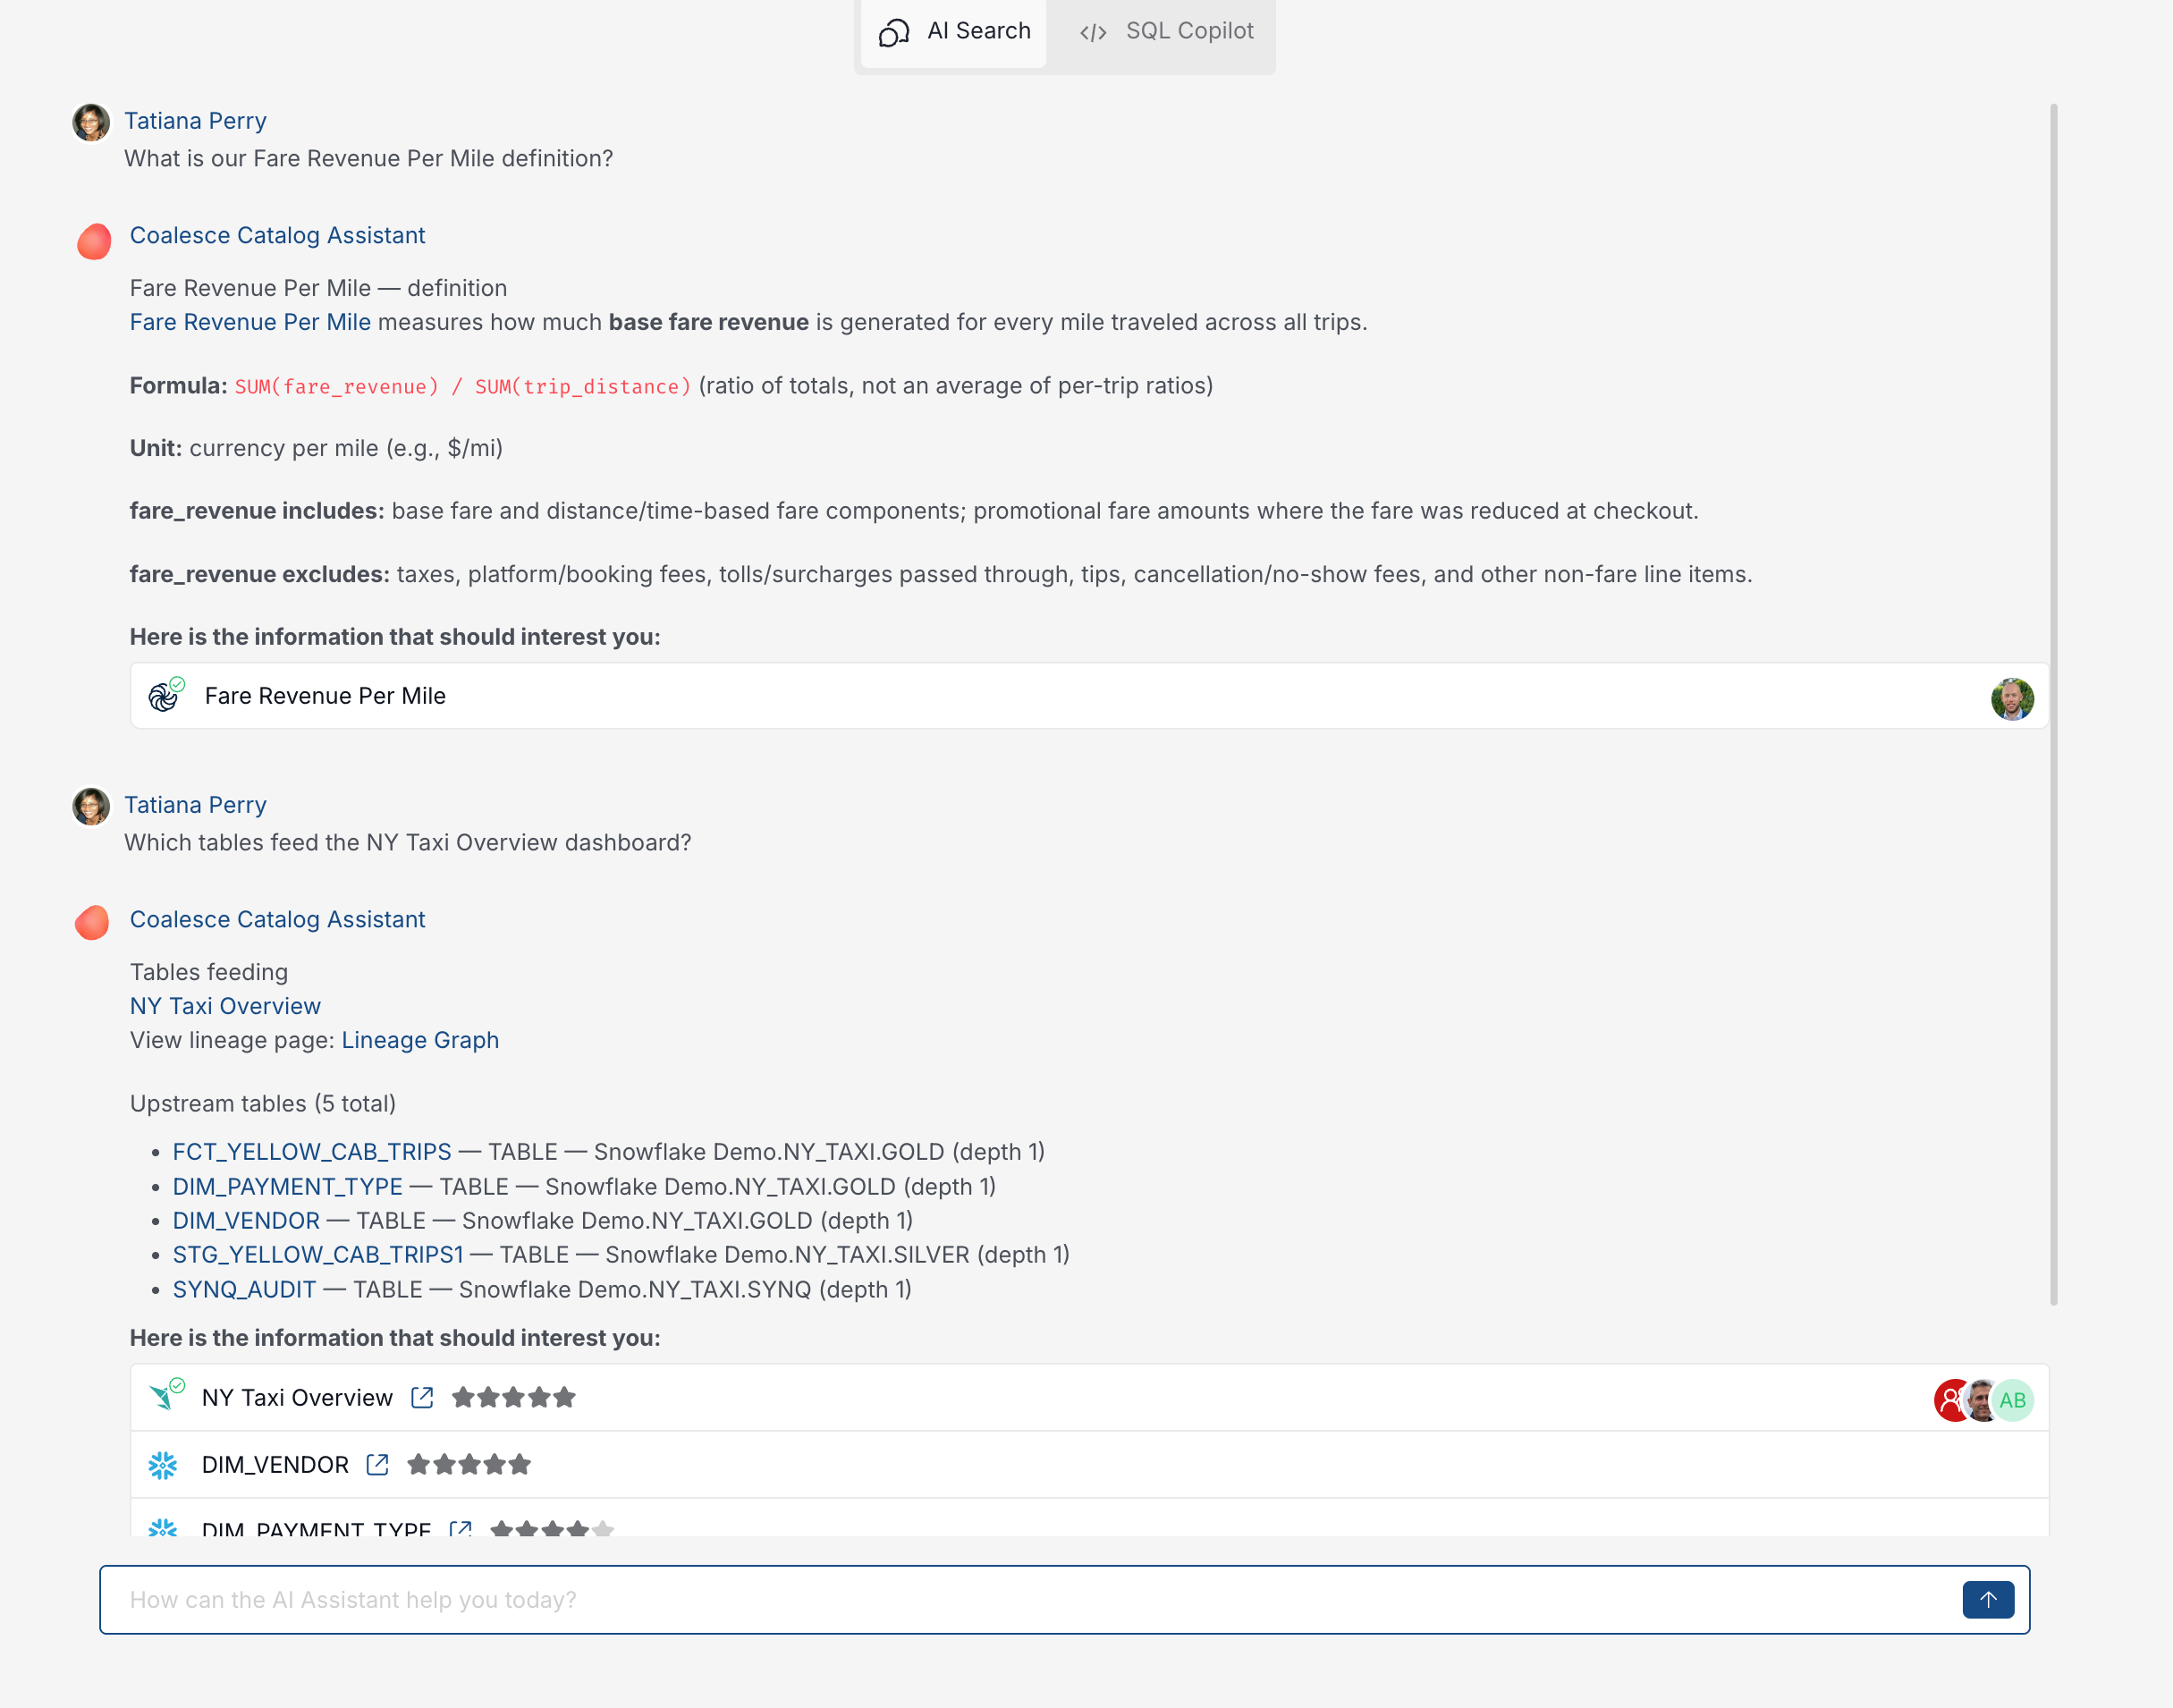
Use this path when you have only a vague question and do not yet know the metric, dashboard, or table name. You can open AI Assistant from the left navigation, or click Ask on Home when AI is enabled. After you get cited assets, open each link and continue the investigation at Step 3 or Step 4 in the table above.
-
In the left navigation, click AI Assistant, or open AI Assistant in Catalog.
-
Ask:
What is our Fare Revenue Per Mile definition?andWhich tables feed the NY Taxi Overview dashboard? -
Open each cited link and confirm Read me, Lineage, and Pinned Assets match what you would expect from Steps 1 to 4.
What's Next?
- Document or refresh Fare Revenue Per Mile and related metrics in Knowledge with Pinned assets to the canonical table and dashboard.
- Deepen lineage troubleshooting in Lineage in Catalog.
- Browse BI assets in Dashboards in Catalog.
- Onboard teammates with the 5-Minute Quick Start Guide.