Documentation index: llms.txt. This page is also available as markdown: append .md to this URL or send Accept: text/markdown.
Dashboards
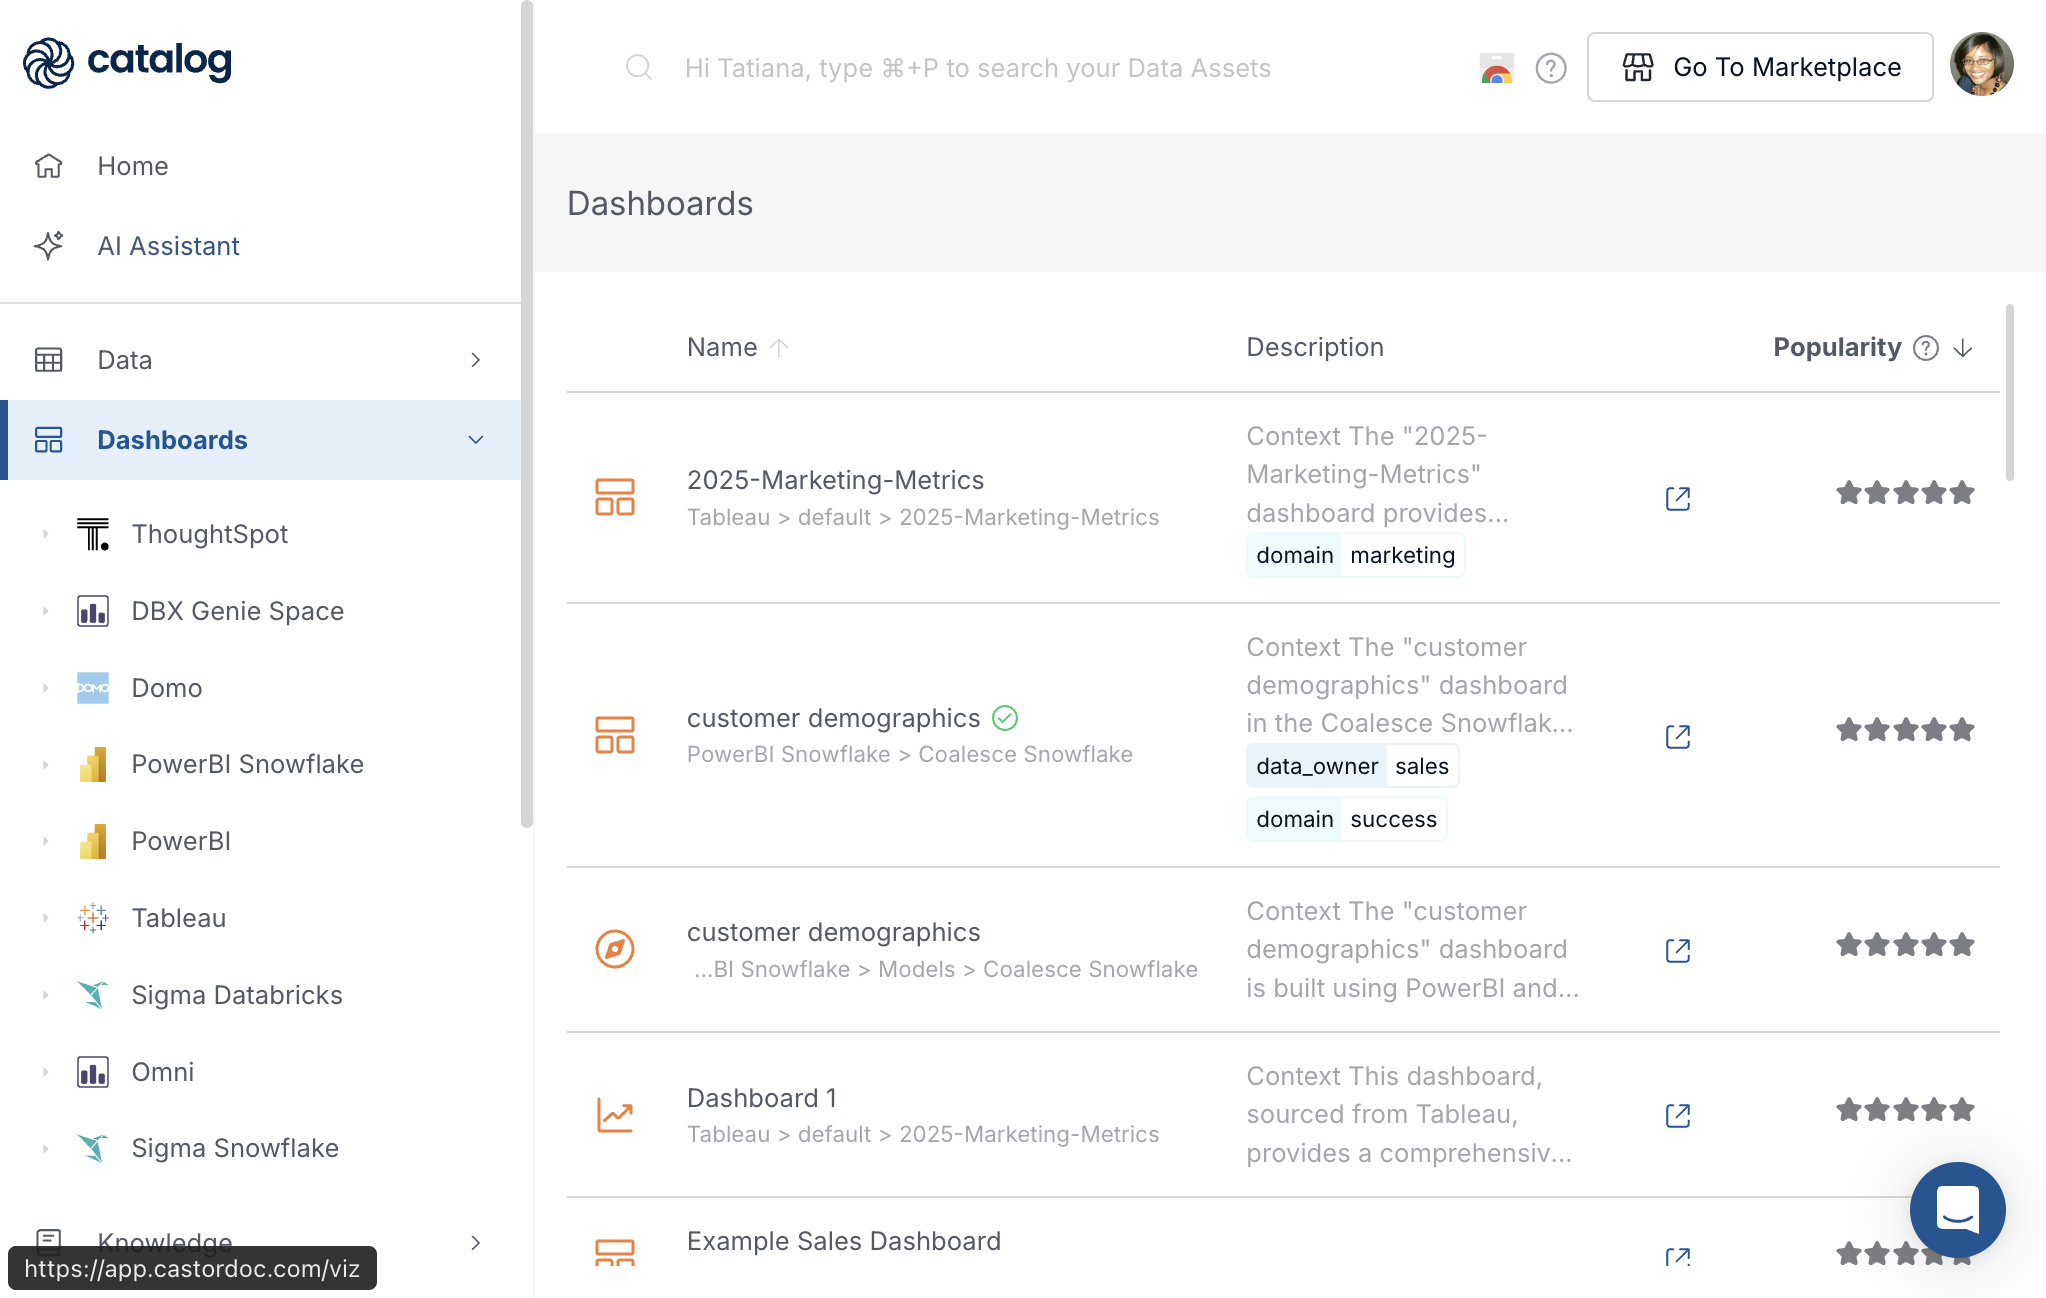
The Catalog surfaces assets from your BI and visualization tools alongside warehouse data. Open Dashboards in the left navigation, or go to the Dashboards hub in Catalog, to browse, document, and trace lineage for every synced visualization asset.
Open the Dashboards Hub
Click Dashboards in the left navigation. Catalog expands the section and shows two areas:
- Left - Every connected visualization integration, for example ThoughtSpot, Domo, Power BI, Tableau, Sigma, or Omni. Click Dashboards again if the list is collapsed.
- Right - A searchable list of visualization assets from all integrations.
List Columns
Every row in the list uses the same three columns:
| Column | What it shows |
|---|---|
| Name | Asset title, an icon for the asset type, and a path showing where the asset lives in the source tool, for example Tableau > default > 2025-Marketing-Metrics. A green checkmark on the name means the asset is verified. |
| Description | A snippet from the Catalog Read Me tab, often labeled Context, plus any tags applied in Catalog. |
| Popularity | A star rating based on view activity in the source tool when that data is available. |
Click any row to open the asset. Use the external-link icon beside the description to open the asset in the native BI tool.
Filter by Integration
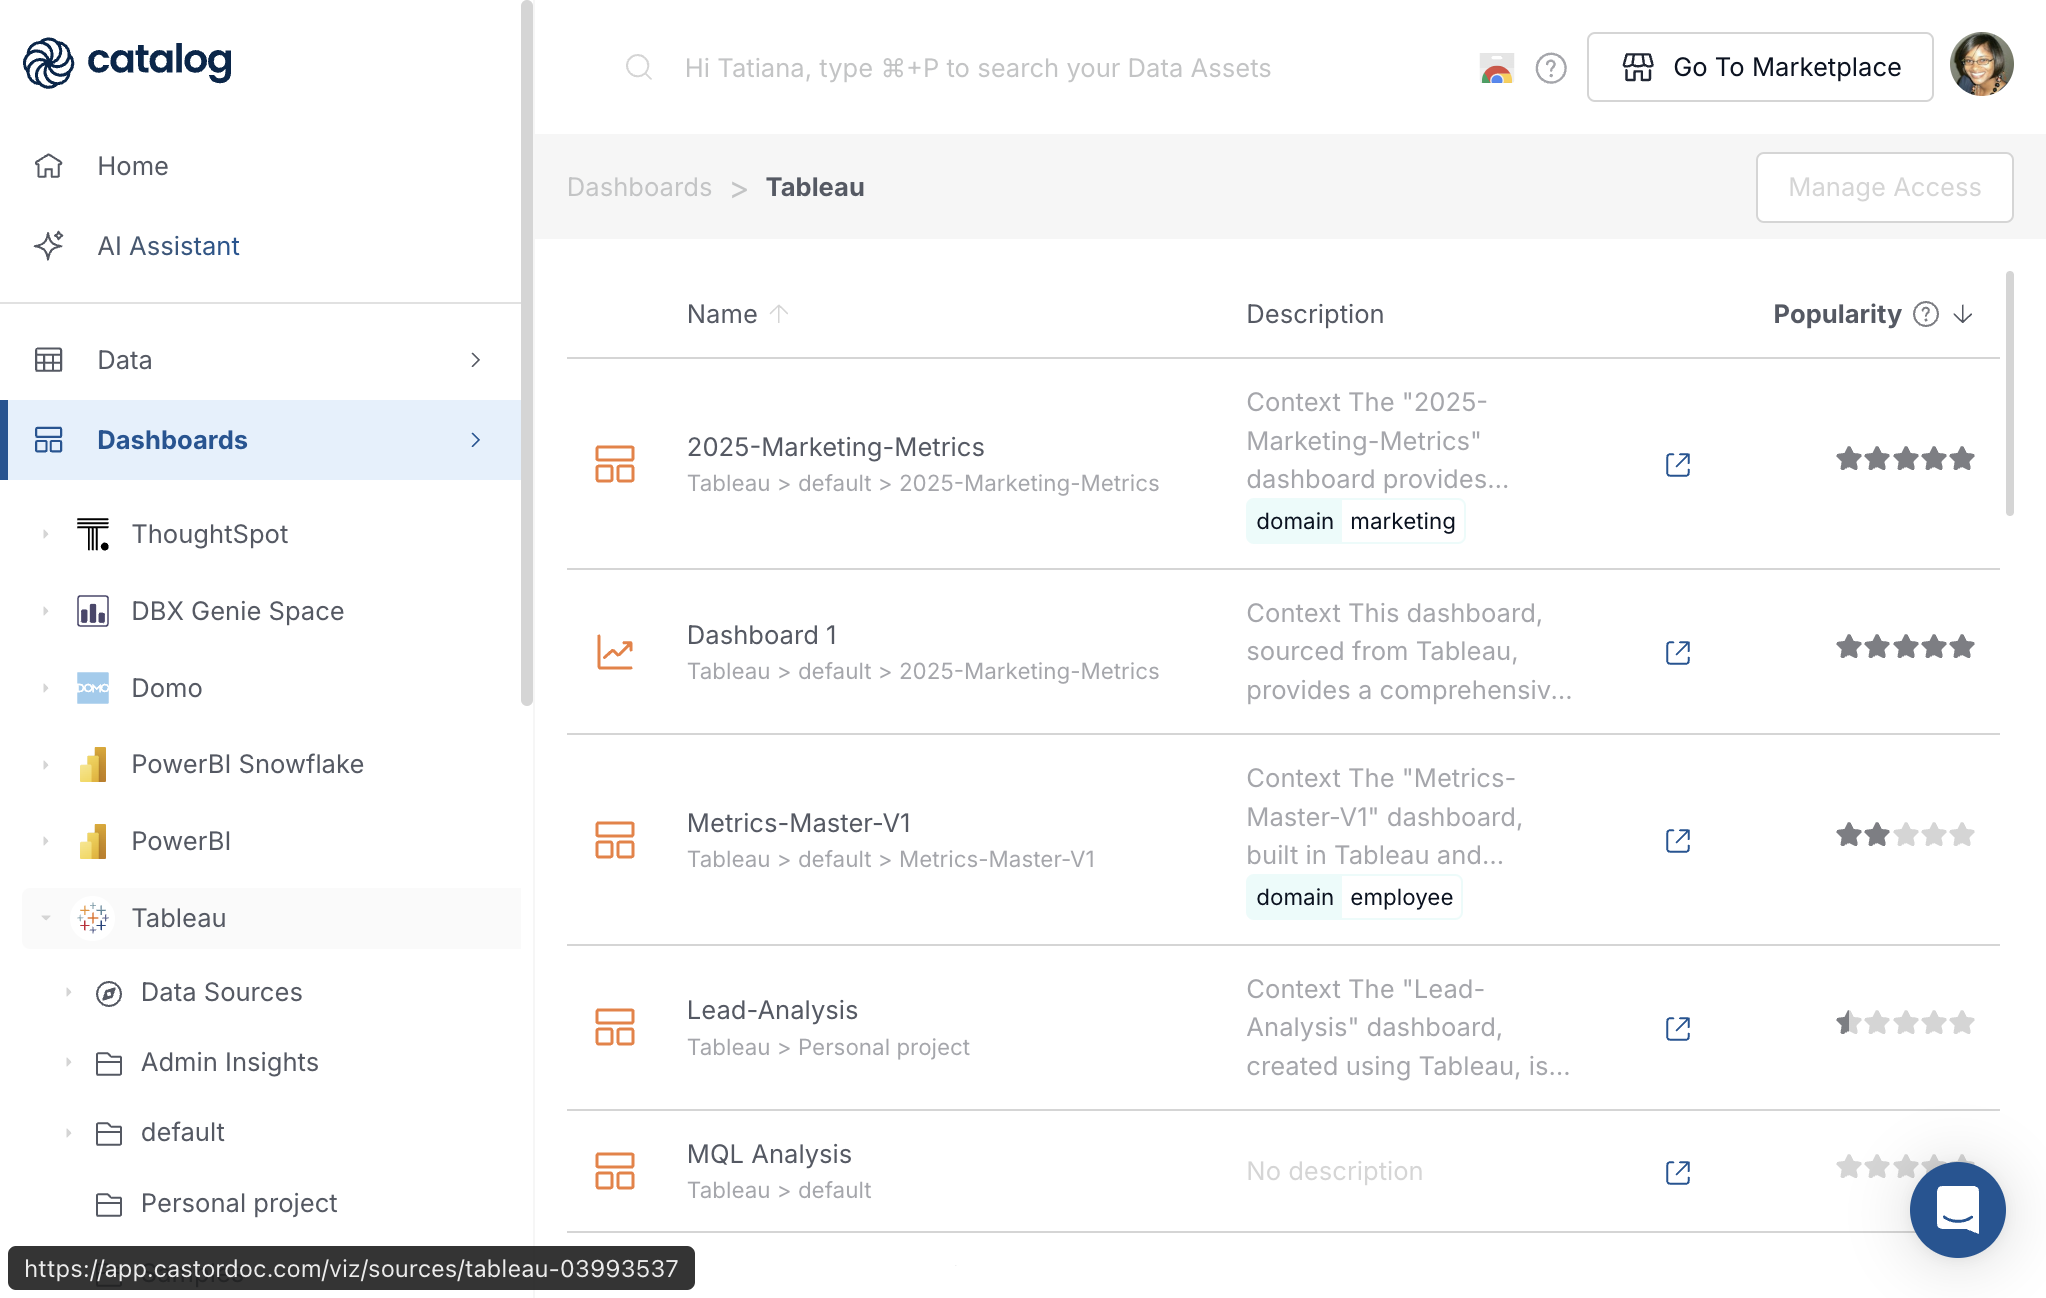
Click an integration name in the left navigation, for example Tableau, to filter the list to that connection only.
Under the integration you typically see:
- A Data Sources entry. The label varies by platform; see the walkthrough below.
- One or more project or folder entries that mirror how content is organized in the source tool, for example default or Personal project.
The right-hand list updates to show only assets from that integration. Breadcrumbs above the list reflect your path, for example Dashboards > Tableau.
Folder and data-source names depend on the platform and how your team organizes content. For connection setup and naming by tool, see Data visualization integrations.
Walkthrough: Tableau Example
The steps below use Tableau as an example. The same navigation pattern applies to other integrations; only folder names and asset labels change.
Browse Data Sources
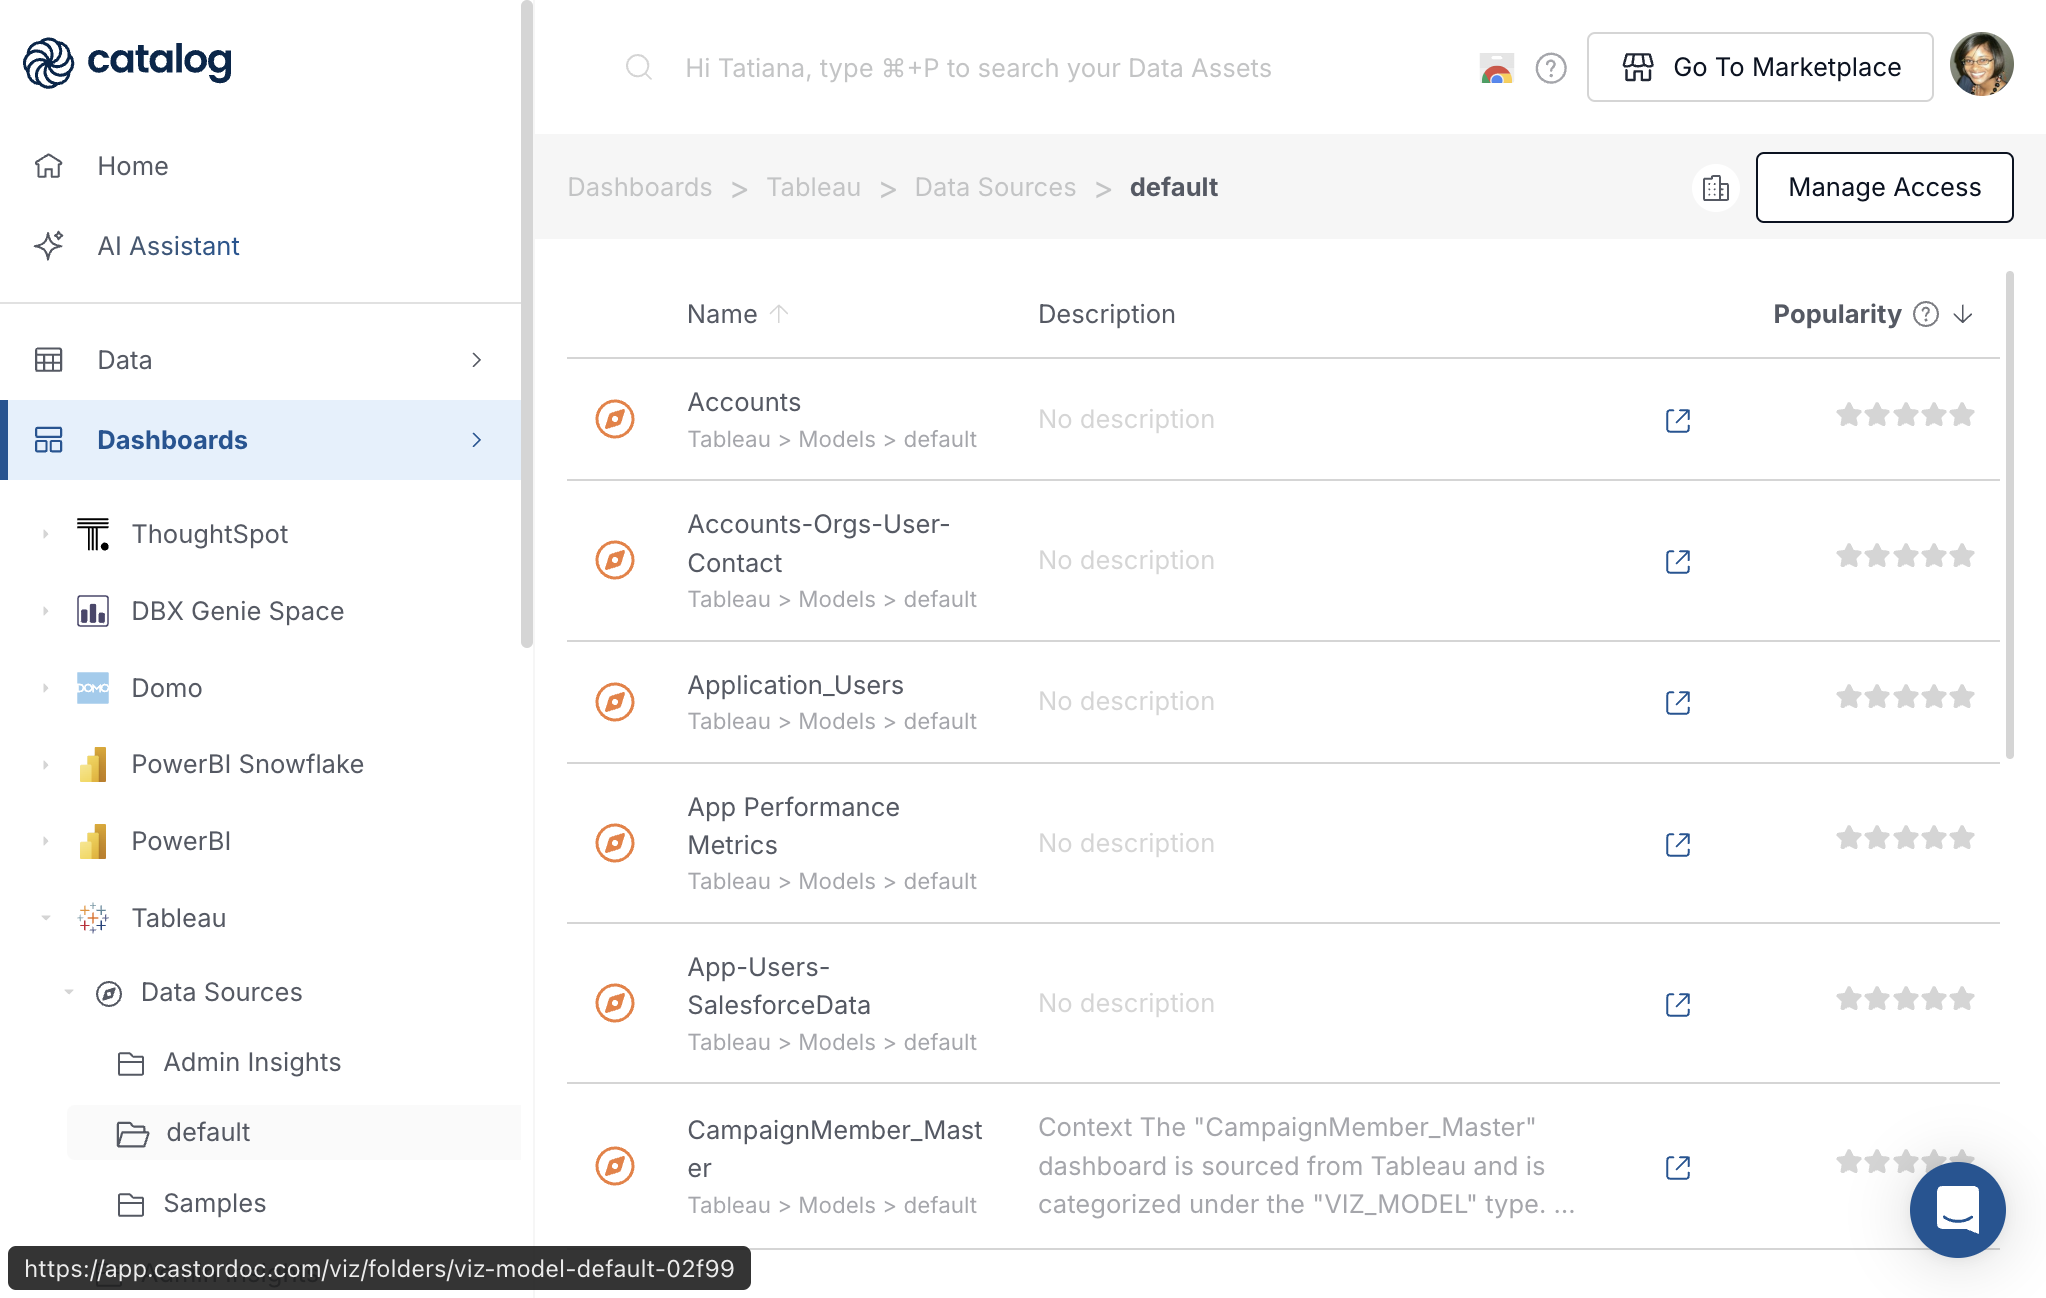
Under Tableau, click Data Sources, then a subfolder such as default.
The list uses the same Name, Description, and Popularity columns. Rows show semantic or modeling assets from Tableau, such as published data sources. The path under each name often includes Models, for example Tableau > Data Sources > default.
Data Source Detail Page
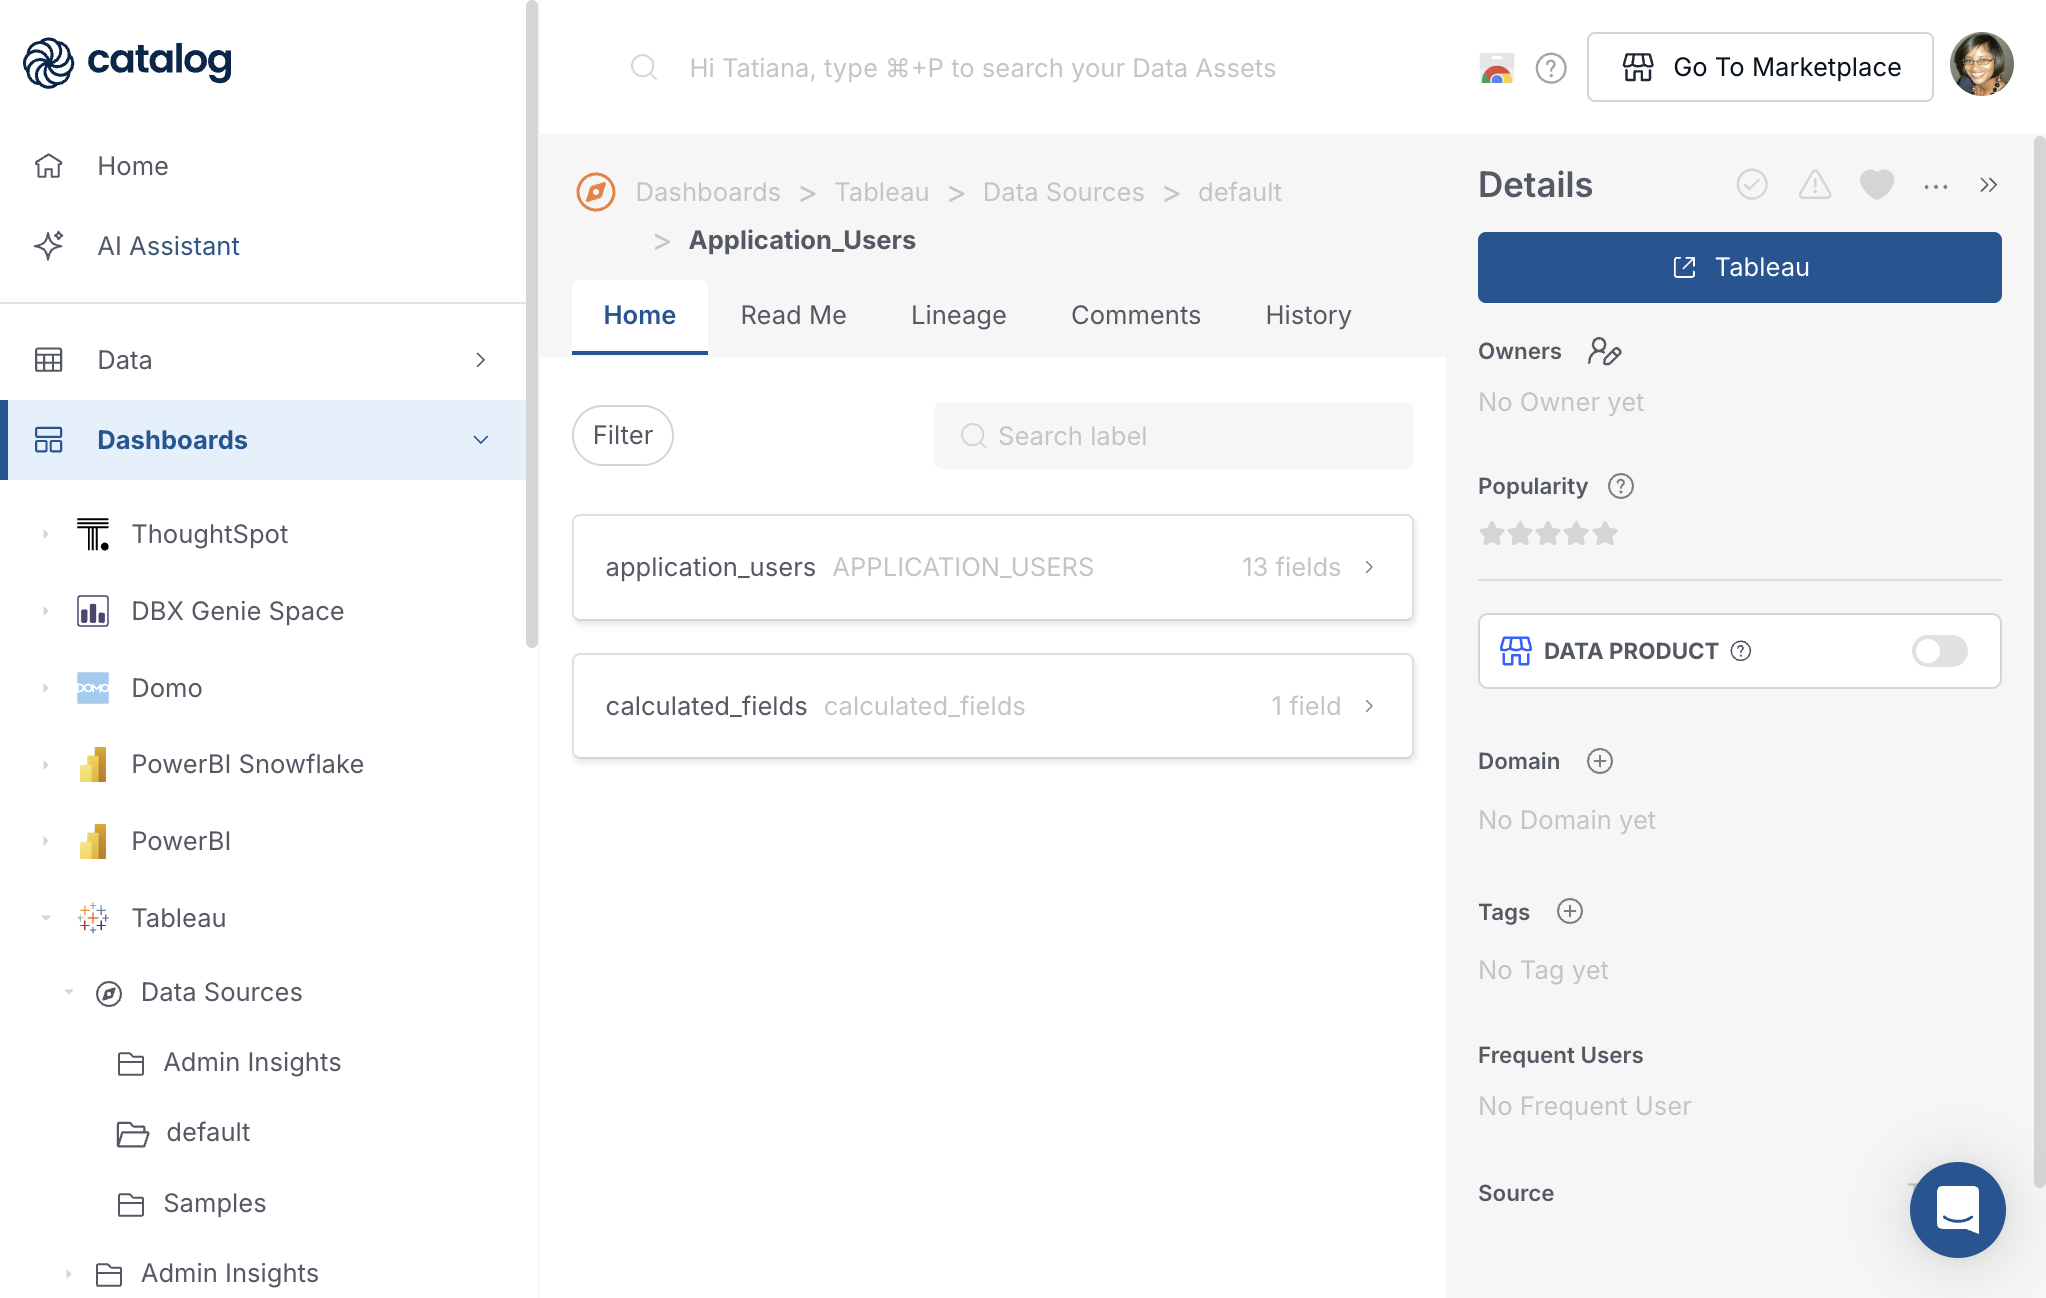
Click a data source, for example Application_Users, to open its page.
Tabs
| Tab | Purpose |
|---|---|
| Home | Fields synced from the source tool, grouped by table or model. Expand a group to see field names, types, and descriptions. Use Filter and Search label to narrow the list. |
| Read Me | Catalog documentation: edit manually, use Describe with AI, or request documentation from owners. |
| Lineage | Upstream warehouse tables and downstream dashboards that use this data source. |
| Comments | Questions and collaboration on this asset. |
| History | Changes to descriptions, owners, tags, and other metadata. |
Details Panel
The Details panel on the right side of every tab shows verified and deprecated status, favorites, Link to source, owners, popularity, data product toggle, domain, tags, frequent users, Mentioned in links to Knowledge pages and other assets, and the source connection. Link to source opens the asset in Tableau.
Field-level lineage on data sources is available for supported integrations. See Data visualization integrations for your tool.
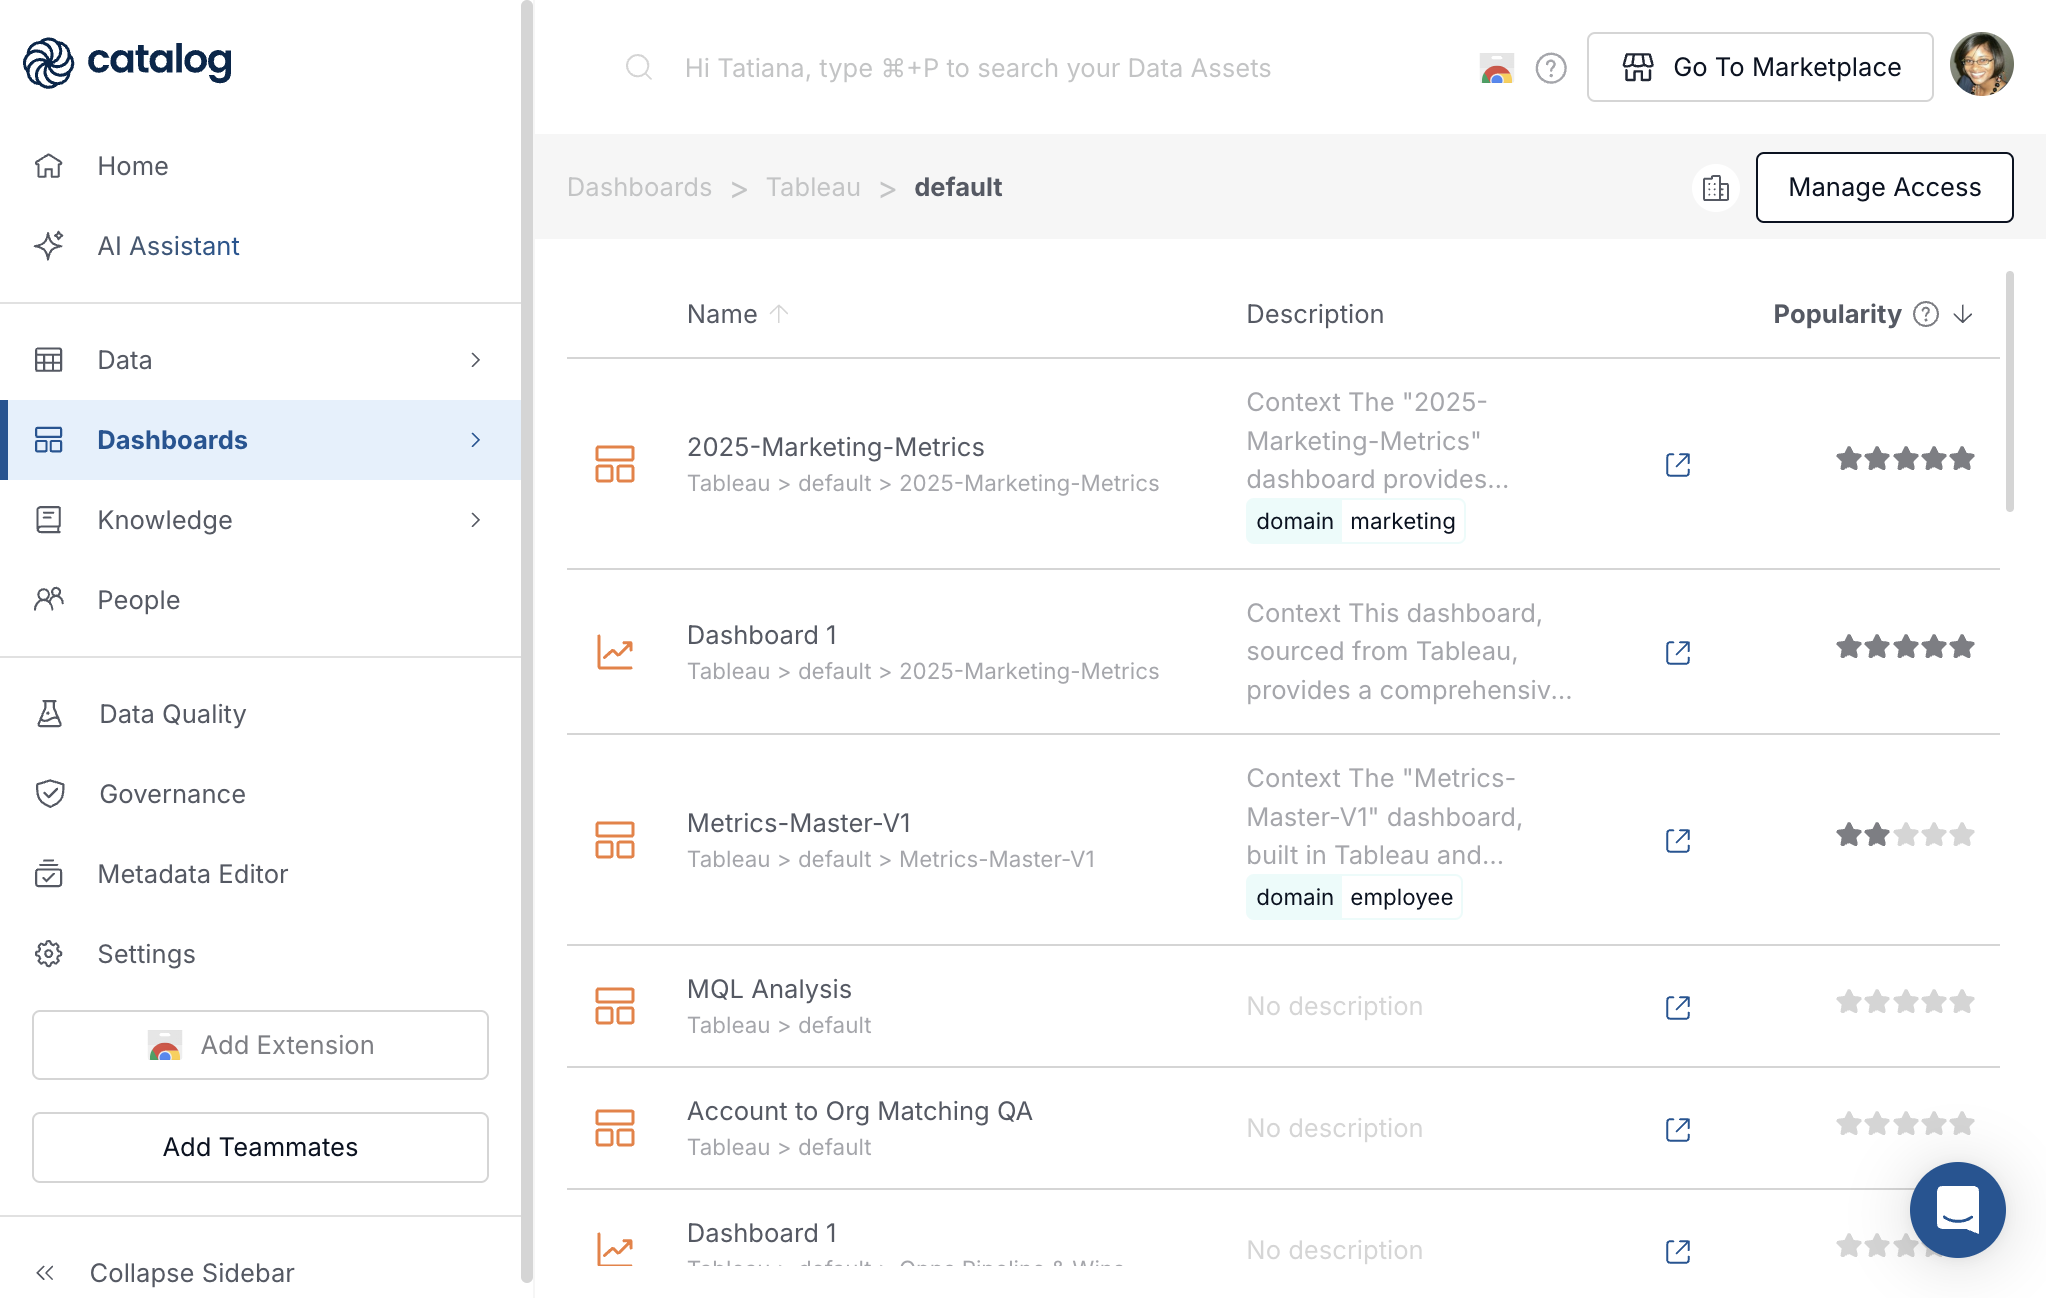
Browse Dashboards in a Project Folder
Under Tableau, click a project folder such as default, not Data Sources.
The list shows dashboards and related content for that project. Icons beside each name indicate the asset type in Catalog:
| Icon | Meaning |
|---|---|
| Grid, four squares | Workbook or top-level dashboard container. |
| Line chart | Individual view, sheet, or chart inside a workbook. |
| Bar chart, horizontal bars | Another dashboard or sheet type, depending on how Tableau exported the asset. |
Open a Workbook Folder
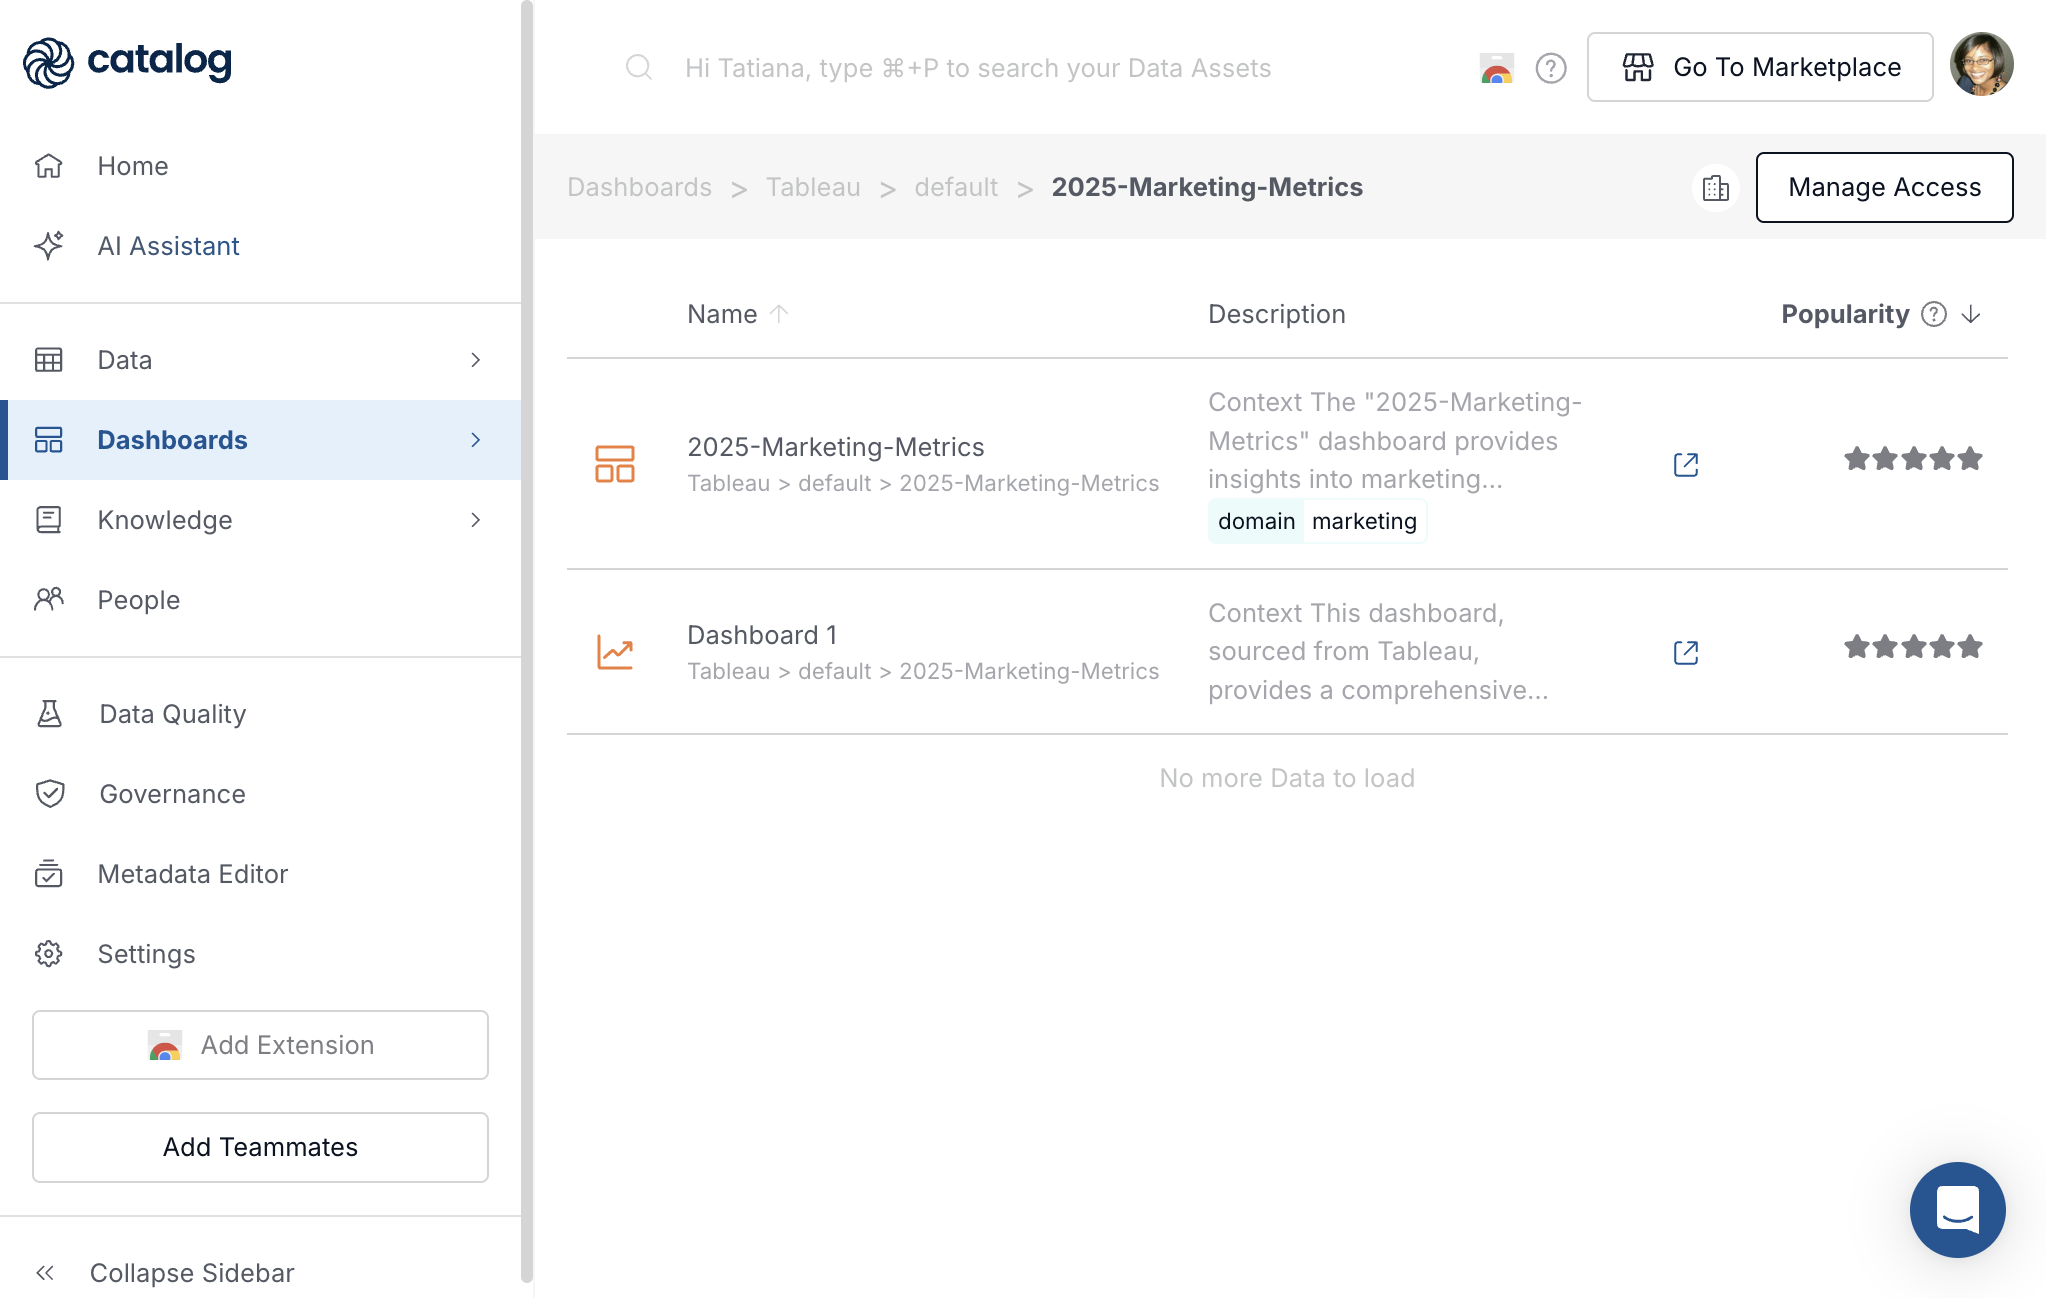
Click a workbook folder in the left navigation, for example 2025-Marketing-Metrics under default.
The list usually contains two kinds of rows:
- The workbook itself, 2025-Marketing-Metrics, with a grid icon.
- Views inside that workbook, for example Dashboard 1, with a line-chart icon.
Both rows use the same Name, Description, and Popularity columns.
Workbook Detail Page
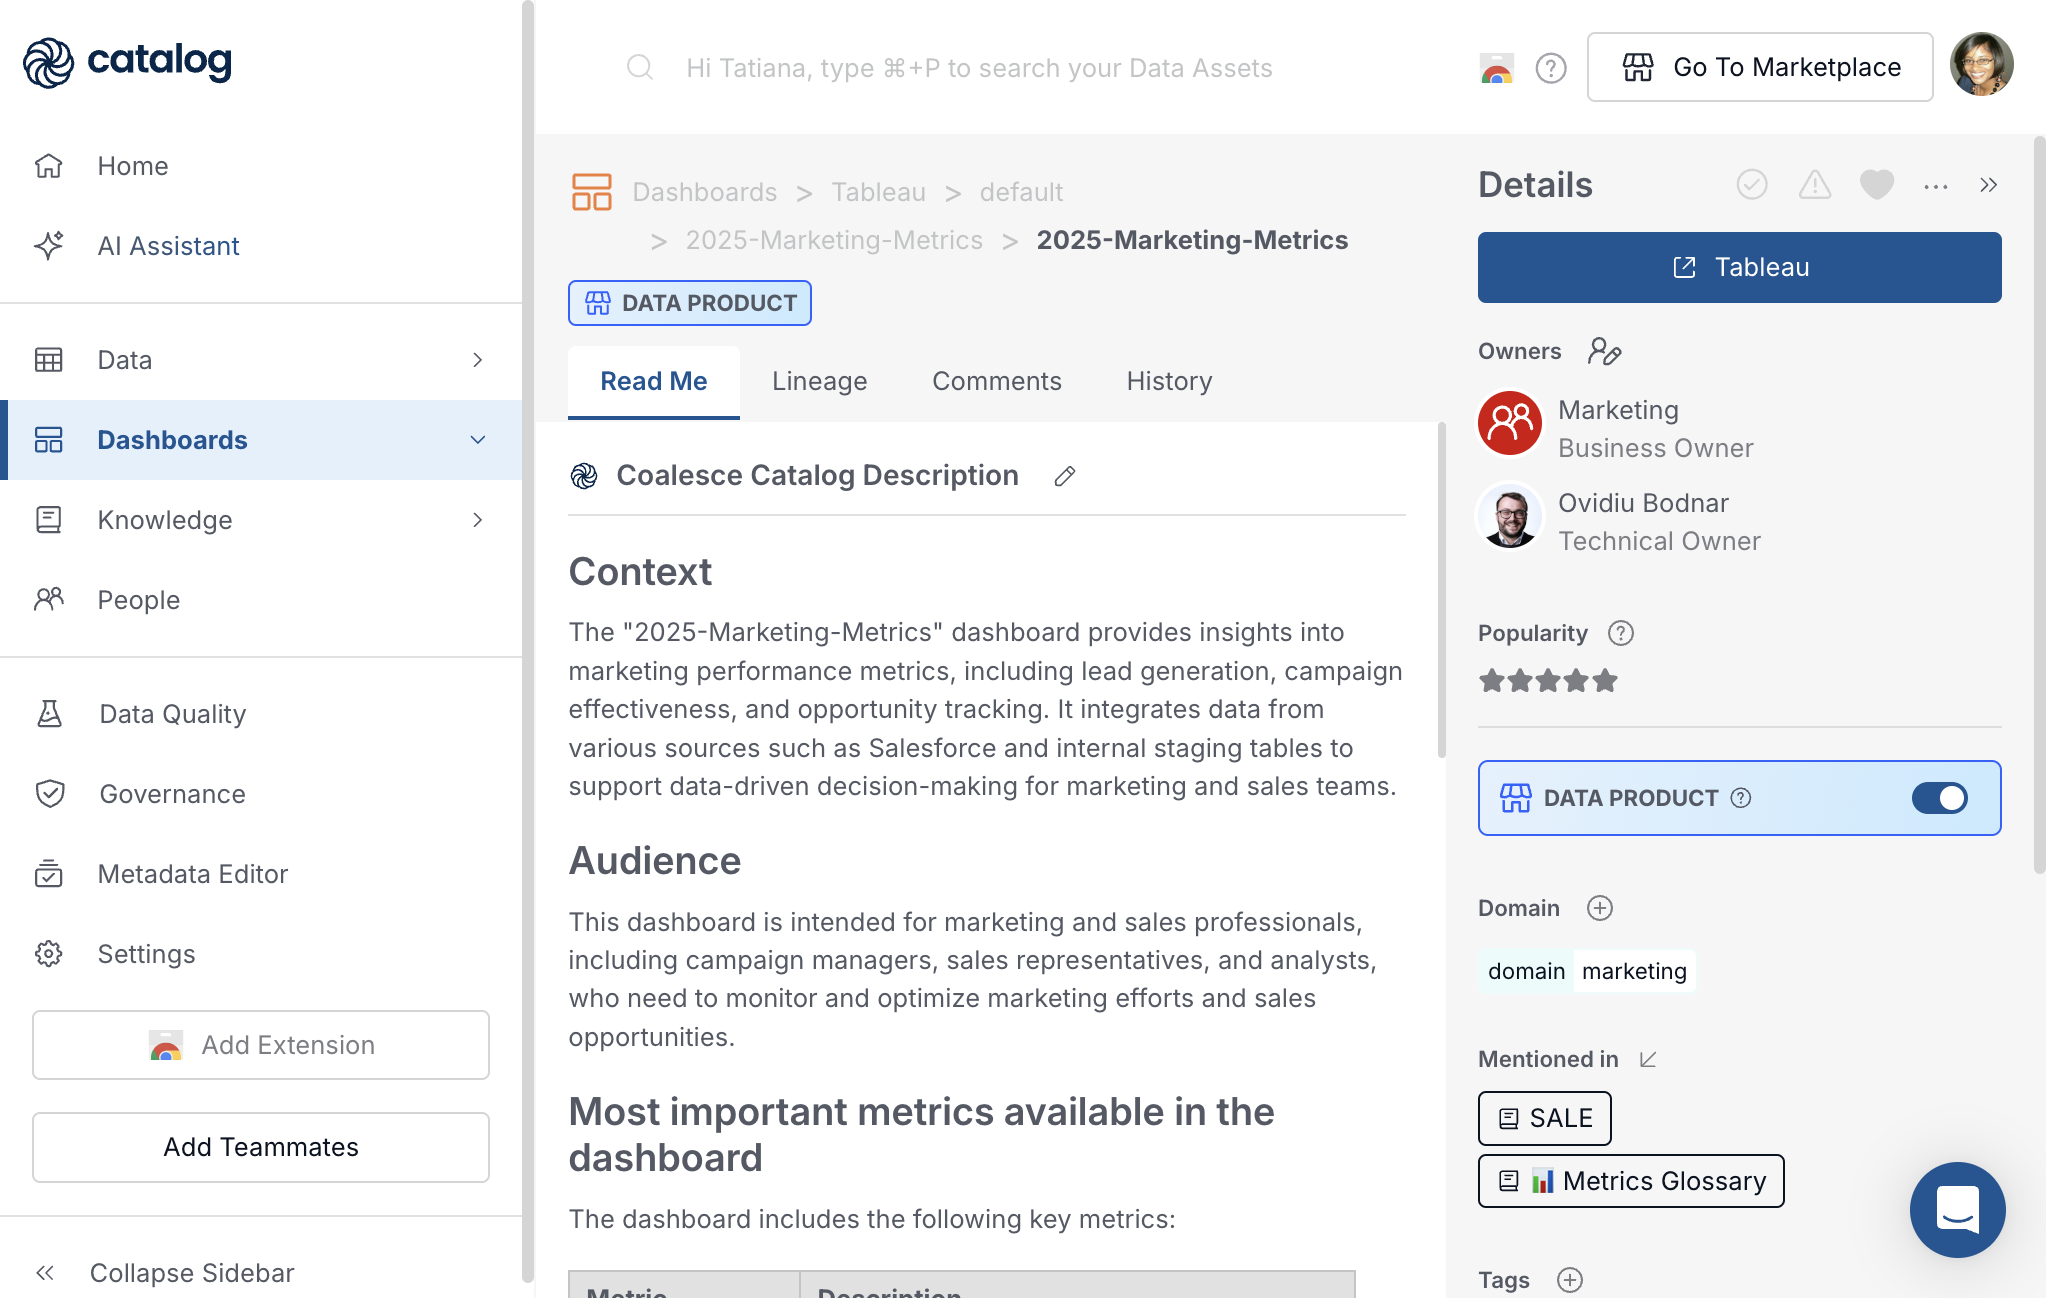
Click the workbook row, 2025-Marketing-Metrics.
Workbook pages include Read Me, Lineage, Comments, and History. They do not include a Home tab; field lists live on data sources.
On the Read Me tab, document purpose, audience, and metrics. Pin related tables, data sources, other dashboards, or Knowledge pages so readers see context without leaving the page. See Pinned assets.
On the Lineage tab, see which warehouse tables and data sources feed this workbook and which downstream assets depend on it.
The Details panel can include Mentioned in links to Knowledge pages and other Catalog assets, plus owners, domain, tags, and a Tableau button to open the live workbook.
View Detail Page
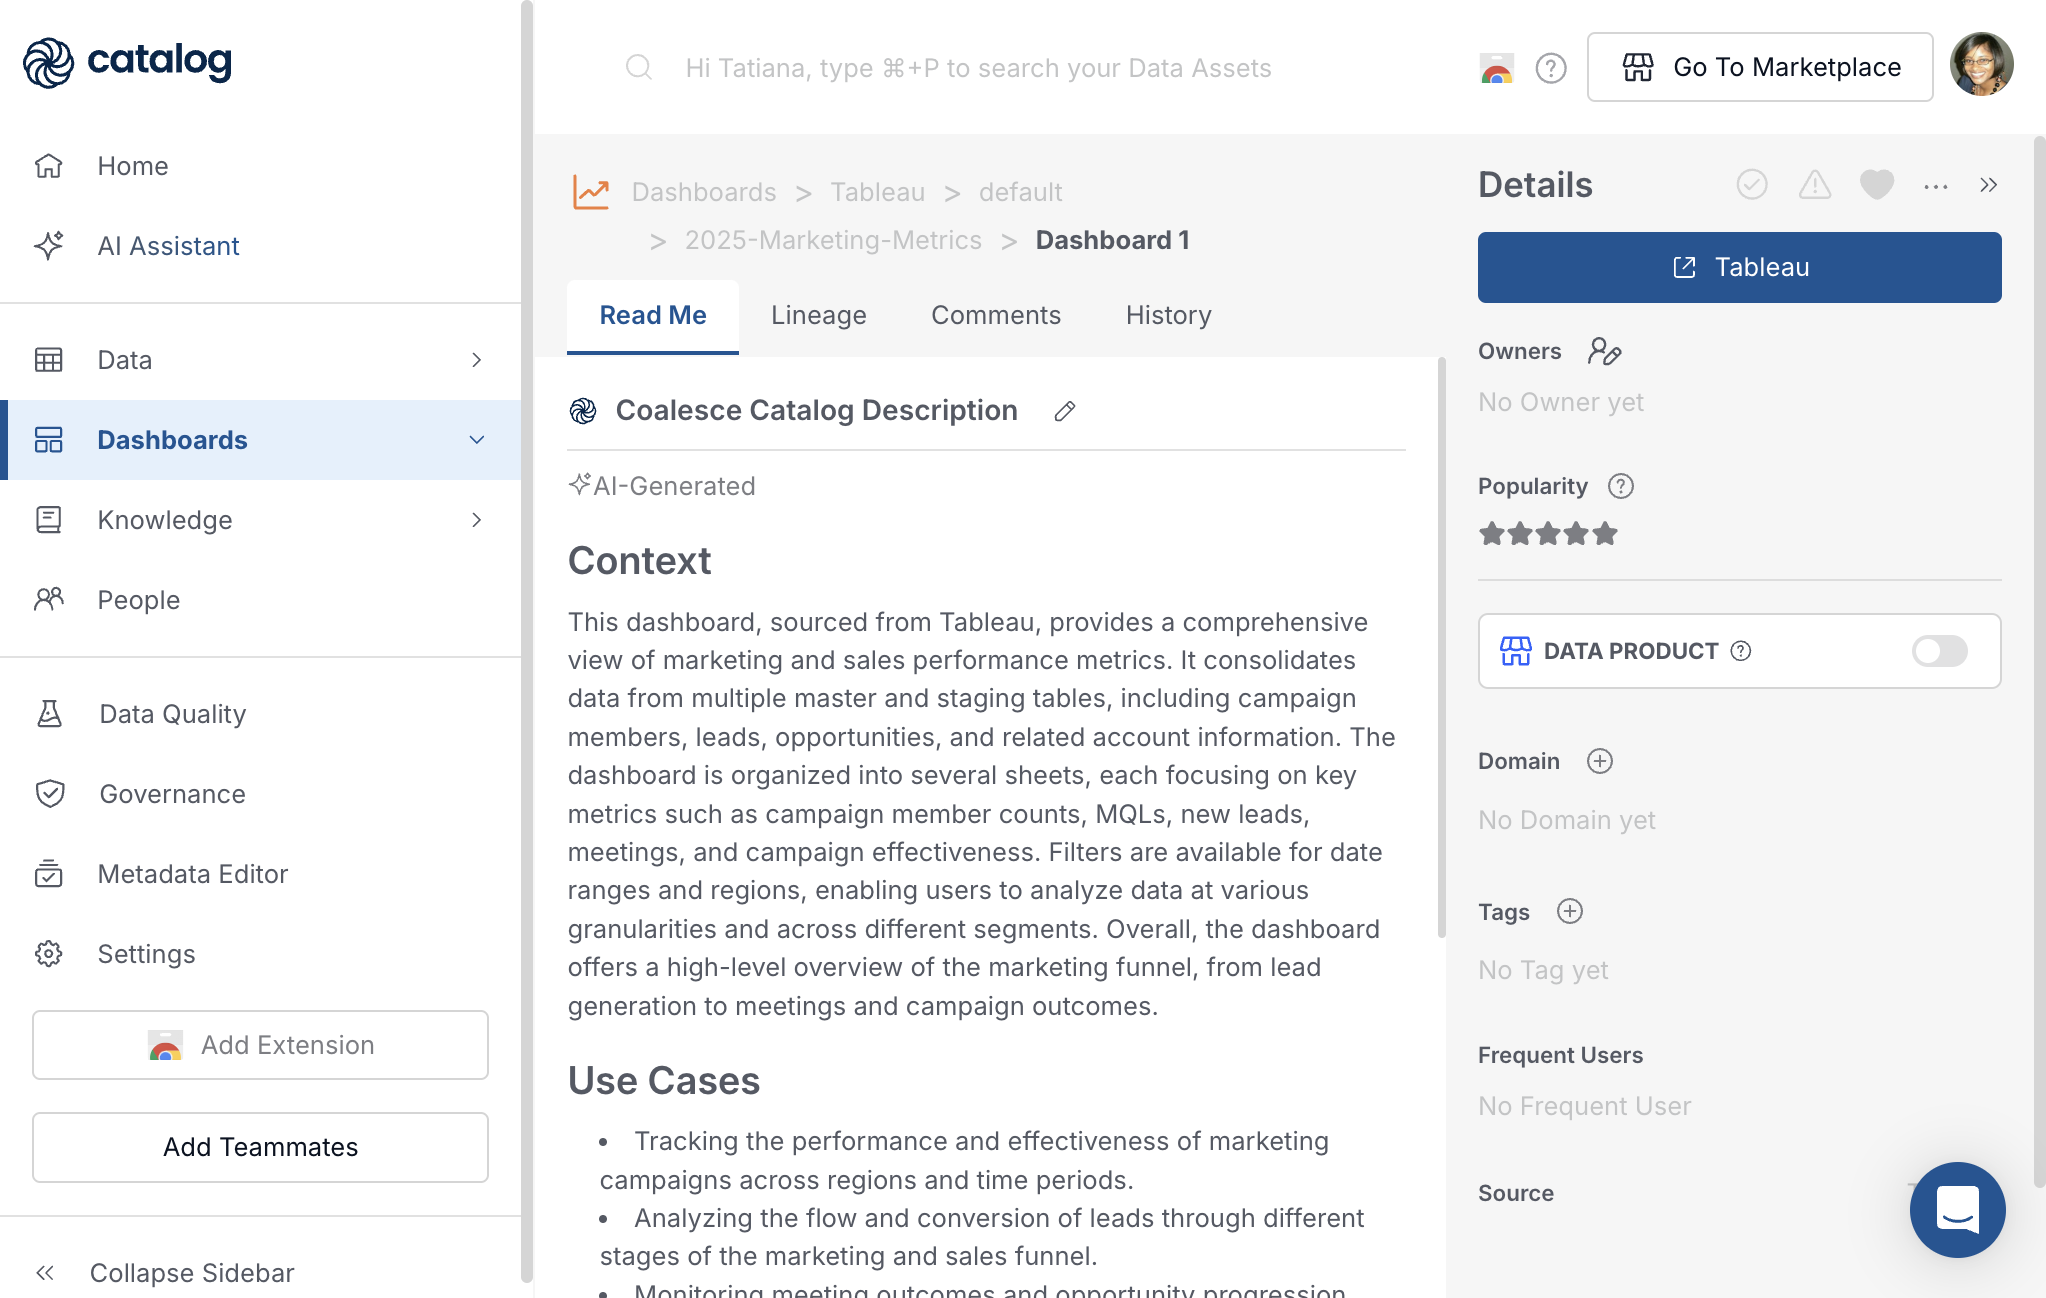
Click a view inside the workbook, for example Dashboard 1.
The page matches the workbook layout: Read Me, Lineage, Comments, History, and the same Details fields. Breadcrumbs include the parent workbook, for example Dashboards > Tableau > default > 2025-Marketing-Metrics > Dashboard 1.
Use the Lineage tab to see tables and data sources behind this specific view. Use the Read Me and Comments tabs the same way as on the workbook.
How Dashboards Connect to the Rest of Catalog
| Catalog area | Connection to dashboards |
|---|---|
| Tables | Lineage links dashboards and data sources to warehouse tables and columns. |
| Knowledge | Document definitions and KPIs; link them from Mentioned in or pin them on the Read Me tab. |
| Reports | Export dashboard metadata, unused-dashboard reports, and governance analytics from Governance. |
| Data visualization integrations | Connect BI tools and control what Catalog syncs. |
Collaboration and Metadata
These capabilities apply on dashboard, view, and data source pages:
- Comments - Discuss the asset on the Comments tab.
- History - Review metadata changes on the History tab. See History for logged change types and governance workflows.
- Governance - Admins can mark assets verified or deprecated from the Details panel. Export metadata through Reports.