Documentation index: llms.txt. This page is also available as markdown: append .md to this URL or send Accept: text/markdown.
Data Quality Dashboard
The Catalog Data Quality Dashboard gives you a centralized view of data quality test results across your data assets. You can see which tables pass or fail tests, how much of your estate has coverage, and which tools are running those tests.
Catalog displays results from your existing data quality tools. It does not run tests itself. Configure integrations such as dbt, Soda, other Quality integrations, or the Quality API to push test results into Catalog.
Accessing the Dashboard
Open the Data Quality Dashboard at https://app.castordoc.com/data-quality.
Tabs and Filters
The dashboard has two tabs: Overview and Result Details. Use the filters at the top to narrow the data:
- Warehouse: Filter by data warehouse
- Database: Filter by database
- Schema: Filter by schema
- Table Tag: Filter by table tag
- Owner: Filter by table owner
- Result Status: Filter by outcome using pass, fail, or warning. Those map to the same states you see in the tables: pass is SUCCESS, fail is ALERT, and warning is WARNING.
Overview Tab
The Overview tab shows a high-level summary of data quality across your tables.
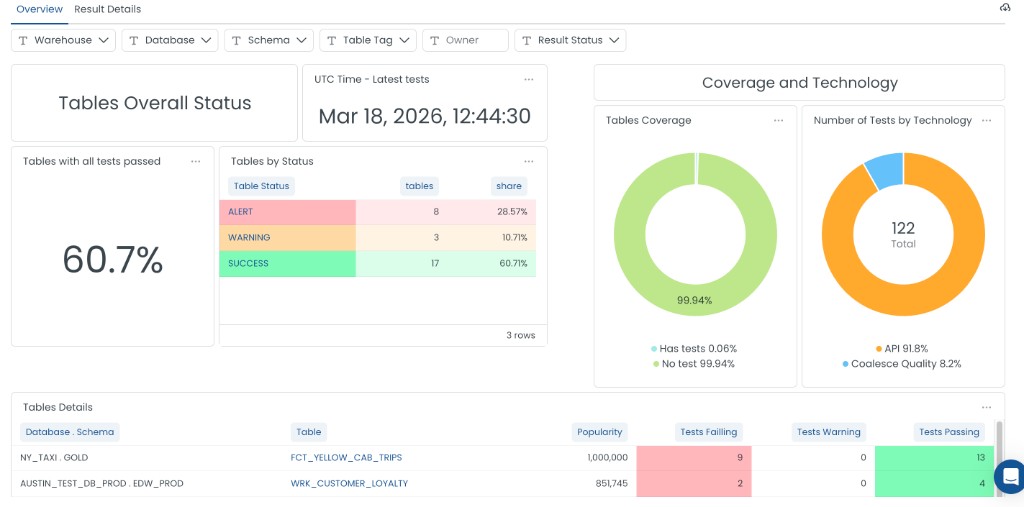
Tables Overall Status
This section summarizes the health of your tables:
- Tables with all tests passed: Percentage of tables where every test is passing. For example, 60.7% means most of your tables are in good shape.
- Tables by Status: A breakdown of tables by their current status:
- ALERT: Tables with one or more failing tests
- WARNING: Tables with tests in a warning state
- SUCCESS: Tables where all tests pass
- UTC Time - Latest tests: Timestamp of the most recent test run. Use this to see how fresh the data is.
Tables Coverage
The Tables Coverage chart shows what percentage of your tables have quality tests:
- Has tests: Tables that have at least one quality test
- No test: Tables with no quality tests
Use this to identify gaps in coverage and prioritize where to add tests.
Number of Tests by Technology
This chart shows how tests are distributed across the tools that run them. You will often see labels such as:
- API: Tests pushed through the Catalog Quality API
- Coalesce Quality: Tests from Coalesce Transform (built-in data quality)
- dbt: Tests from dbt
- Soda: Tests from Soda
- Monte Carlo: Tests from Monte Carlo
- Sifflet: Tests from Sifflet
Tables Details
The Tables Details table lists individual tables and their test performance. Columns include:
- Database . Schema: Location of the table (for example,
NY_TAXI . GOLD) - Table: Table name
- Popularity: Usage score based on query activity
- Tests Failing: Count of failed tests (highlighted in red)
- Tests Warning: Count of tests in warning state (highlighted in yellow)
- Tests Passing: Count of passed tests (highlighted in green)
Use this table to identify tables that need attention and drill into specific assets.
Result Details Tab
The Result Details tab shows a granular view of individual test results. Use it to see which specific tests failed, when they ran, and what the outcome was. This helps you investigate issues and track resolution over time.
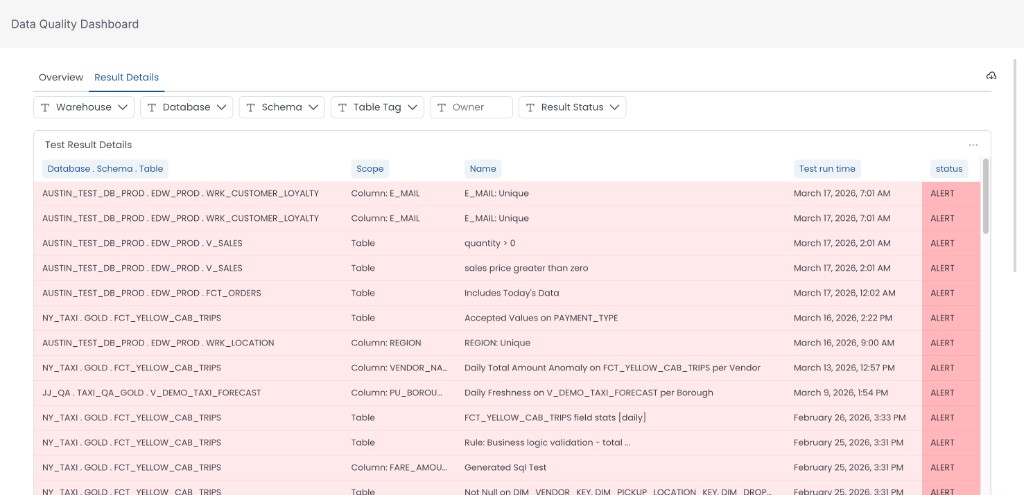
Test Result Details Table
The Test Result Details table lists each test run with the following columns:
- Database . Schema . Table: Full path of the data asset being tested (for example,
AUSTIN_TEST_DB . PROD . EDW_PROD . WRK_CUSTOMER_LOYALTY) - Scope: Whether the test applies to a specific column (for example,
Column: E_MAIL) or the entire table (Table) - Name: The name of the data quality rule or test (for example,
E_MAIL: Unique,quantity > 0,Includes Today's Data) - Test run time: When the test was last executed
- Status: Outcome of the test: ALERT (failed), WARNING, or SUCCESS (passed)
Use the cloud icon or the three-dot menu at the top right of the table to export or download the results.
Data Quality at the Asset Level
You can also see data quality when browsing individual tables. Click the table name to view the Data Quality.
- Overall quality status for that table
- Individual test results (passed, failed, warning)
- Test execution timestamps
- Historical test performance
The Overview and Result Details tabs summarize estate-wide coverage and recent runs. They are not week-over-week trend charts. For longer historical context on one table, click on the table and go to the Data Quality tab.
Setup and Configuration
Enabling Data Quality Integration
To surface test results in the dashboard, connect the tool that runs your tests. For Coalesce-built pipelines, work through the following in order.
- Coalesce Transform and Coalesce Quality: Configure a Warehouse integration in Catalog first. Without it, the first Coalesce Transform ingestion cannot complete. Then create a Coalesce Quality source.
- External tools: Use the Quality API to push test results to Catalog.
- dbt, Soda, or other partners: Configure the matching integration under Quality integrations.
Visibility
Data quality visibility follows asset visibility. If a table or schema is hidden in Catalog, its quality tests will not appear in the dashboard. Quality information uses the same permission model as data assets.
Troubleshooting
Quality Tests Not Appearing
- Verify the integration is configured correctly (dbt, Soda, API, Coalesce Transform plus Coalesce Quality source, or another quality tool).
- Check that the source tables and schemas are visible in Catalog.
- Ensure API credentials have the right permissions if you use the Quality API.
Missing Test Results
- Confirm tests are running in your quality tool.
- Check API integration logs for errors.
- Verify test metadata is being sent correctly to Catalog.
What's Next?
- Integrate dbt tests or Soda with Catalog
- Push test results with the Quality API
- Document tables and view quality in the Data Quality tab