How to UNPIVOT
You may have a use case that requires unpivoting. Unpivoting rotates a table by transforming columns into rows. UNPIVOT is a relational operator that accepts two columns, along with a list of columns, and generates a row for each column specified in the list. For example:
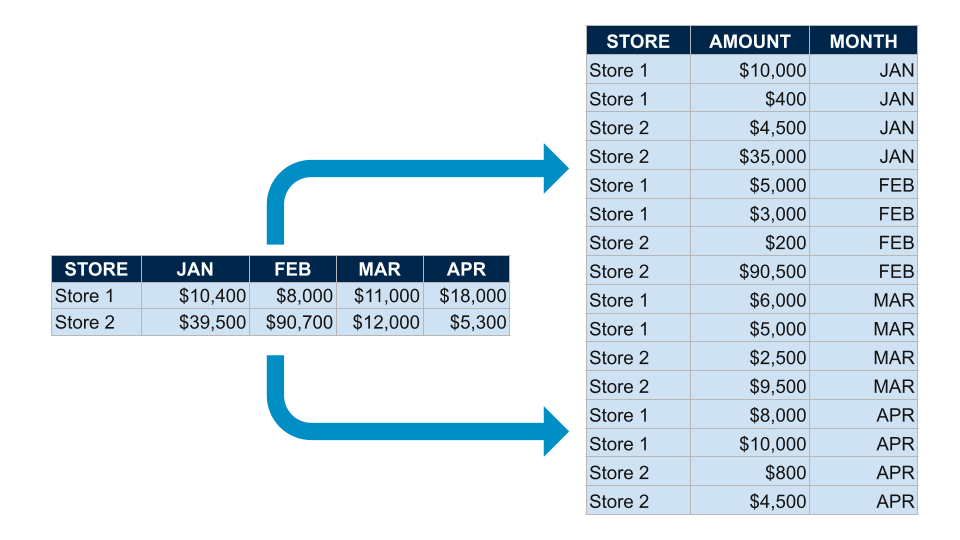
See Snowflake’s UNPIVOT documentation for more information on this functionality.
In Coalesce, UNPIVOT can be achieved via two differing approaches:
- Stage Node
- View Node with the Override Create SQL option enabled in the Node’s configuration
The approach you select will depend on your and your organization's preferences. You will still have to craft the UNPIVOT SQL as detailed in Snowflake’s UNPIVOT documentation under both approaches.
UNPIVOT Using a Stage Node
To implement an UNPIVOT in Coalesce via a Stage Node, complete the following steps:
-
In the Browser of the Build Interface, ensure you have added the Node (Source, Stage, etc.) that you will perform the UNPIVOT on.
-
In the DAG, Right click on the Node that you will perform the UNPIVOT on and select Add Node > Stage.
-
In the Mapping tab of the Node Editor for the Stage, re-configure your column names, transforms, data types, and sources to reflect what will be returned by the UNPIVOT statement. This should include keeping your row columns, in order, deleting all of the columns that you will UNPIVOT, and adding columns for the column values and metrics you will be UNPIVOTing. Leave the Source for each column blank, and fill in the Transform for each column with the column name as it will be returned from the SQL via the JOIN configuration described in Step 4. For example:
-
If you have a sourcing Node with the structure pictured below.
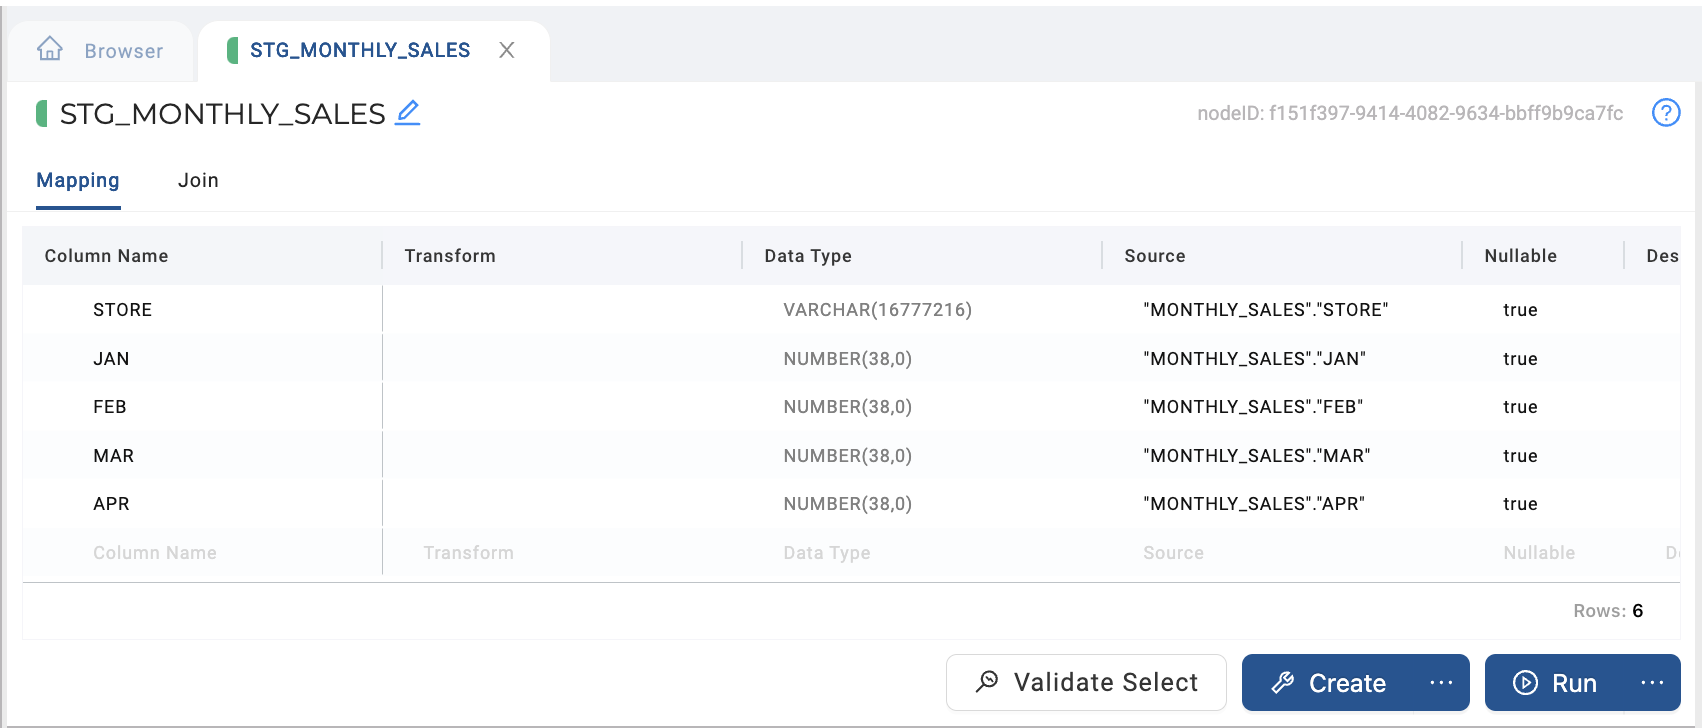
-
And you wish to UNPIVOT the individual month columns into a single month column, you would configure your Stage Mapping as pictured below.
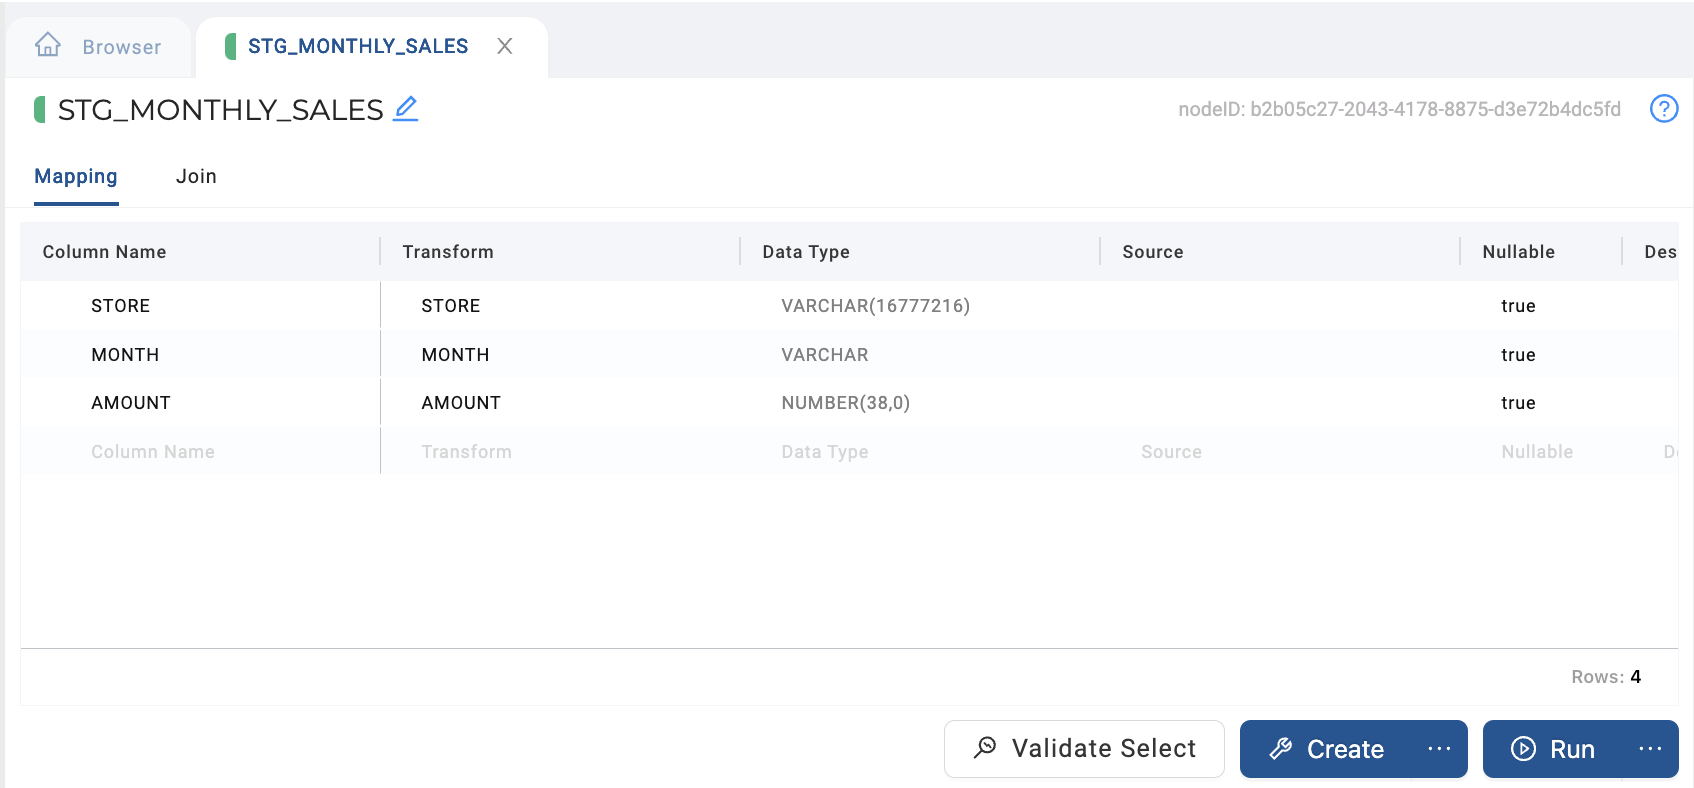
-
-
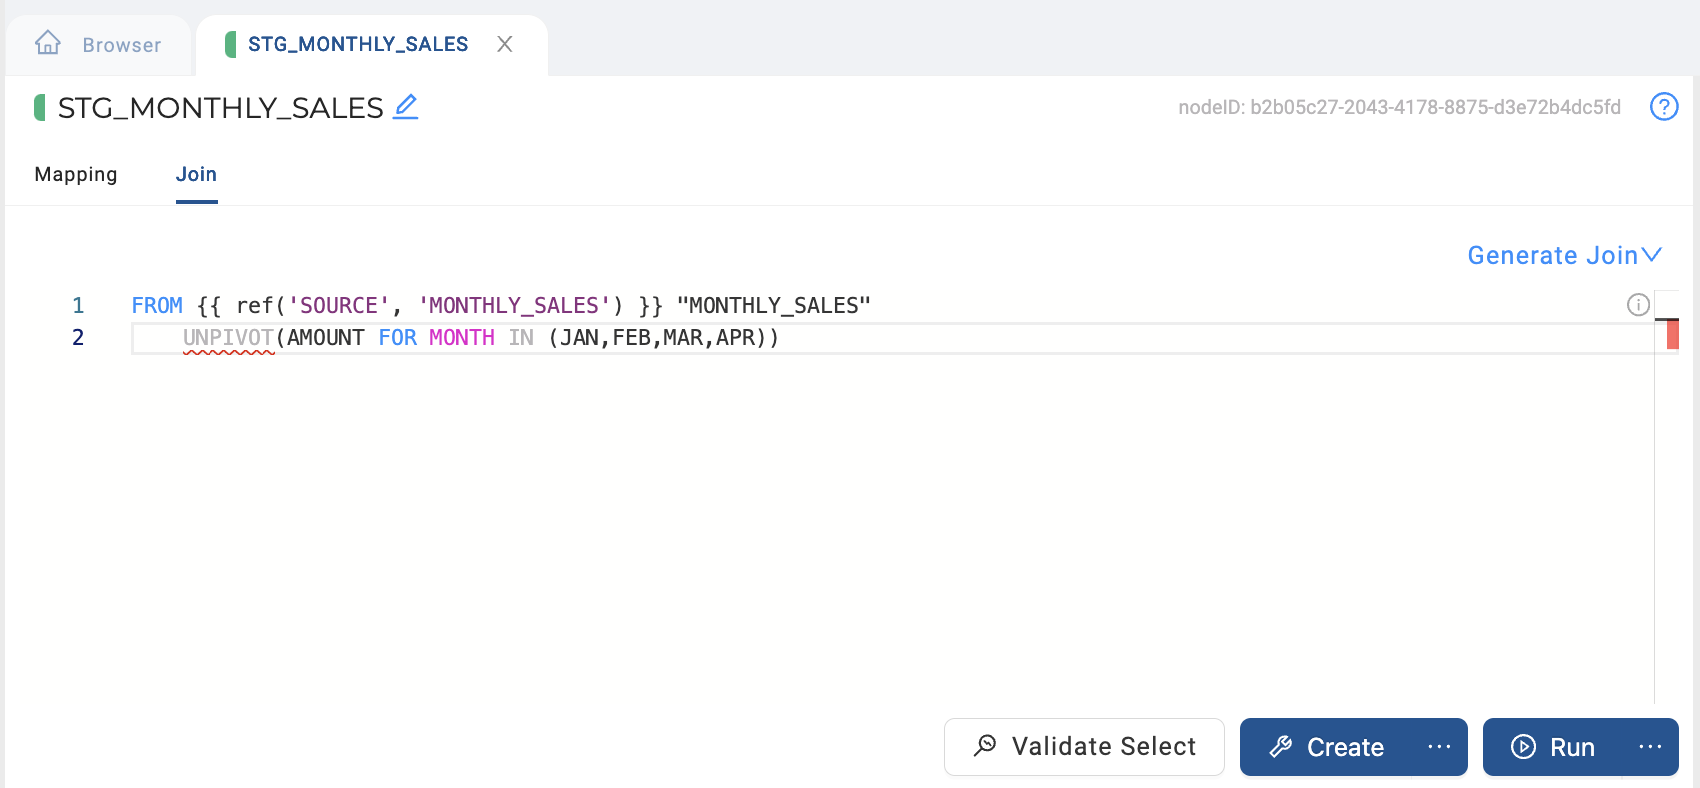
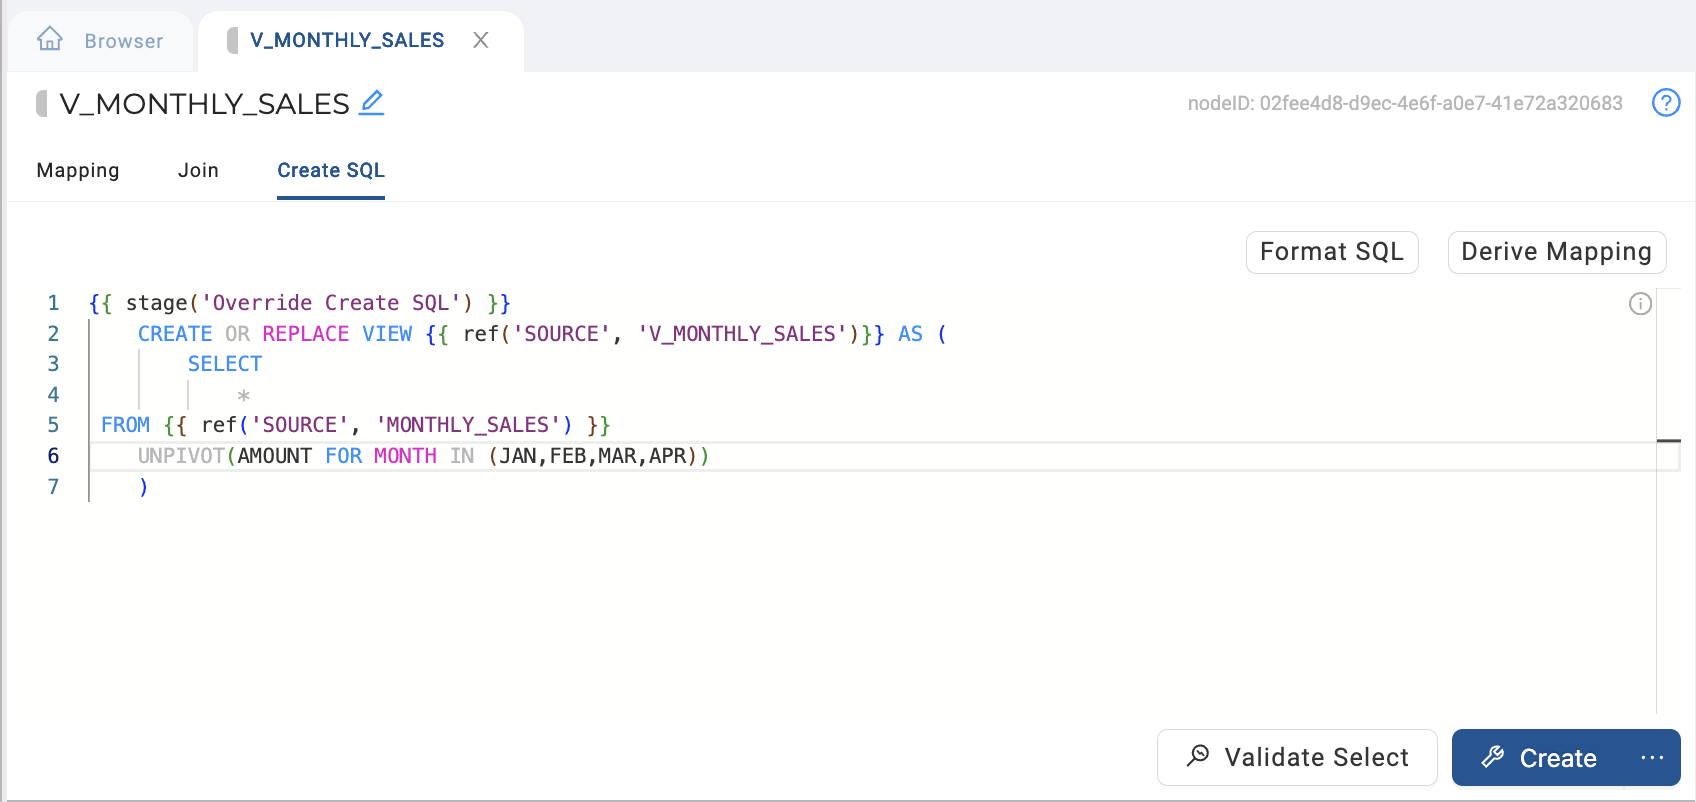
Navigate to the Join tab of the Node Editor and update your join to include your UNPIVOT clause after your FROM clause. For the example detailed above, this UNPIVOT clause would be UNPIVOT(AMOUNT FOR MONTH IN (JAN,FEB,MAR,APR)) as pictured in the example below.
-
Within the Node Editor:
- Validate Select.
- Validate Create.
- Create.
- Validate Run.
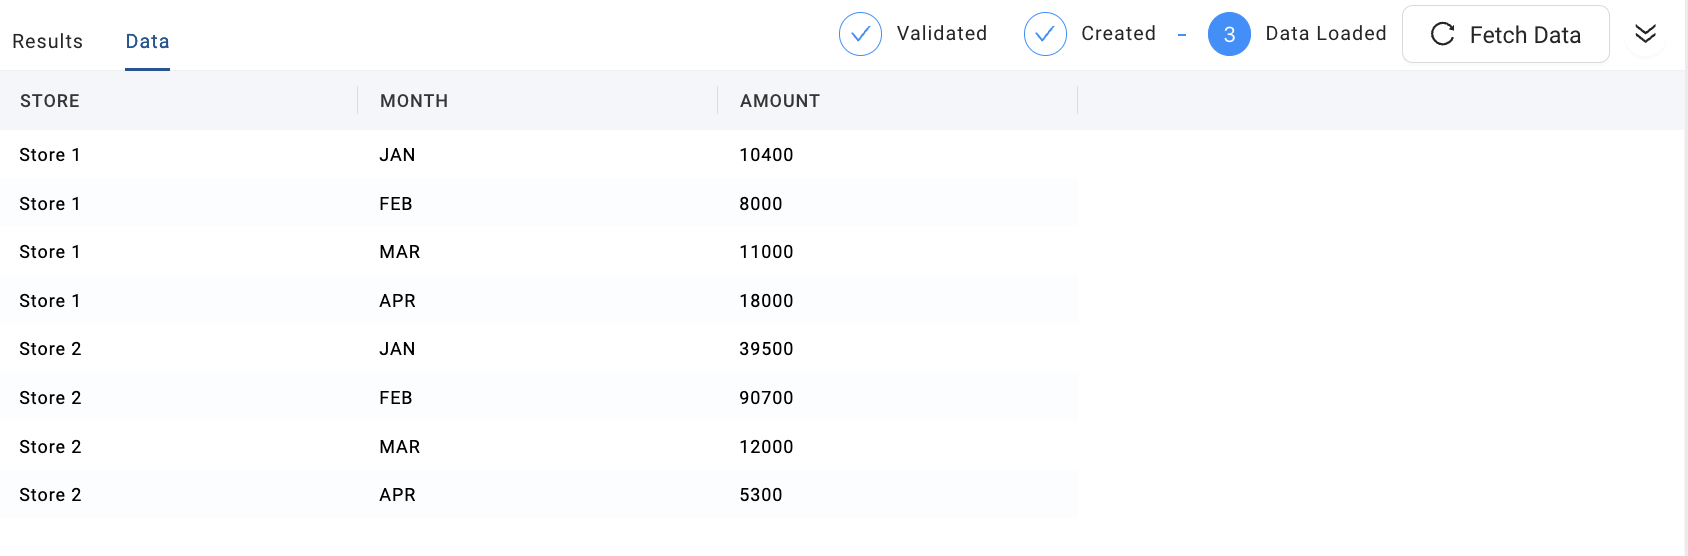
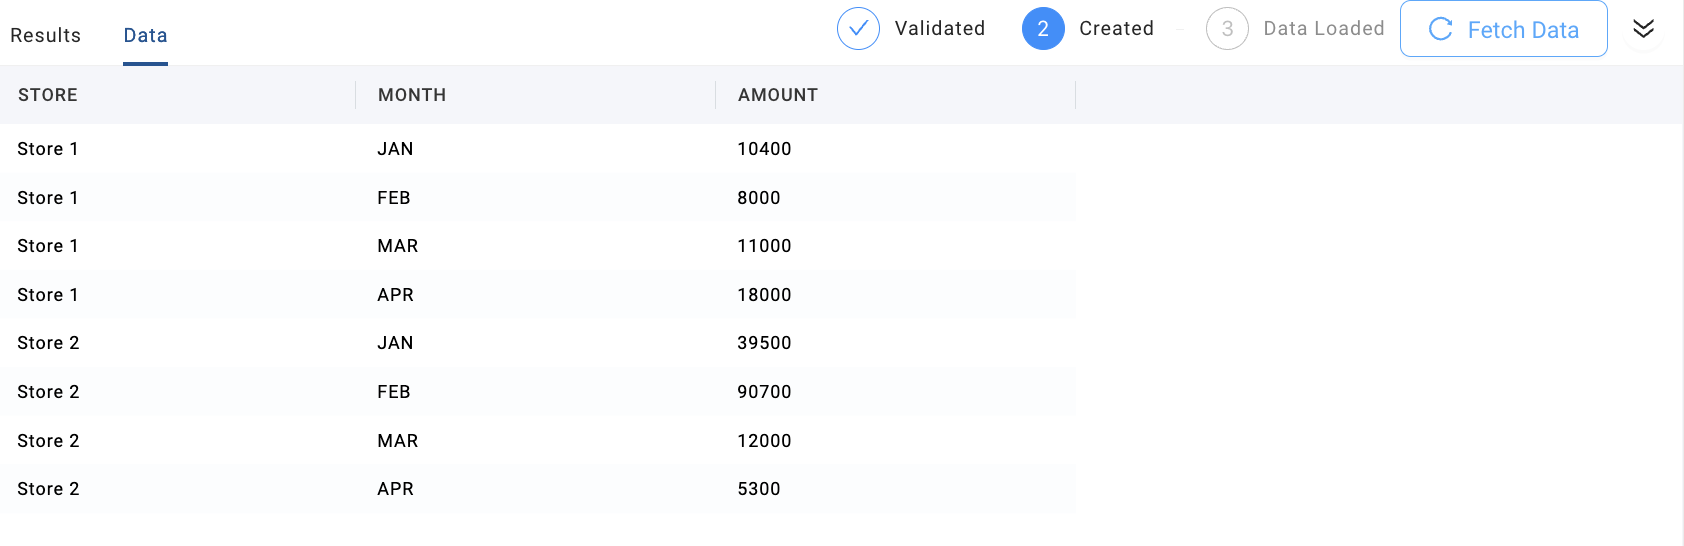
- Fetch data, and view unpivoted results.
-
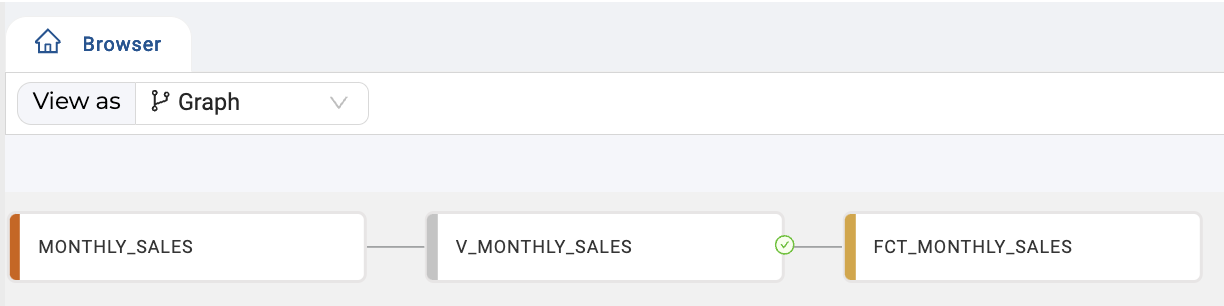
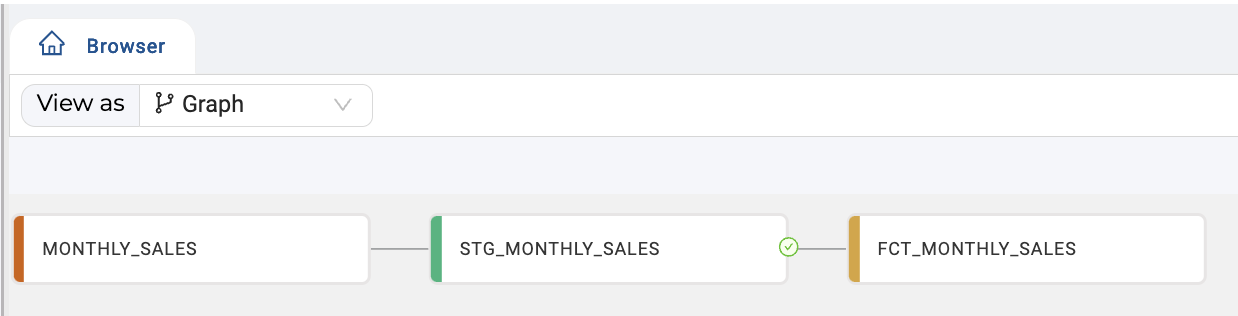
Proceed to add the dependent downstream Nodes for your data pipeline, whether it be direct to target or additional processing Nodes. For example:
UNPIVOT Using a View Node With Override Create SQL
To implement an UNPIVOT in Coalesce via a View Node with Override Create SQL enabled, complete the following steps:
-
In the Build Settings of your Workspace in the Coalesce UI, enable the View Node Type if it is not already enabled for your workspace. This Node Type is disabled by default.
-
In the DAG of the Build Interface, ensure you have added the Node (Source, Stage, etc.) that you will perform the UNPIVOT on.
-
Right click on the Node that you will perform the UNPIVOT on and select Add Node > View.
-
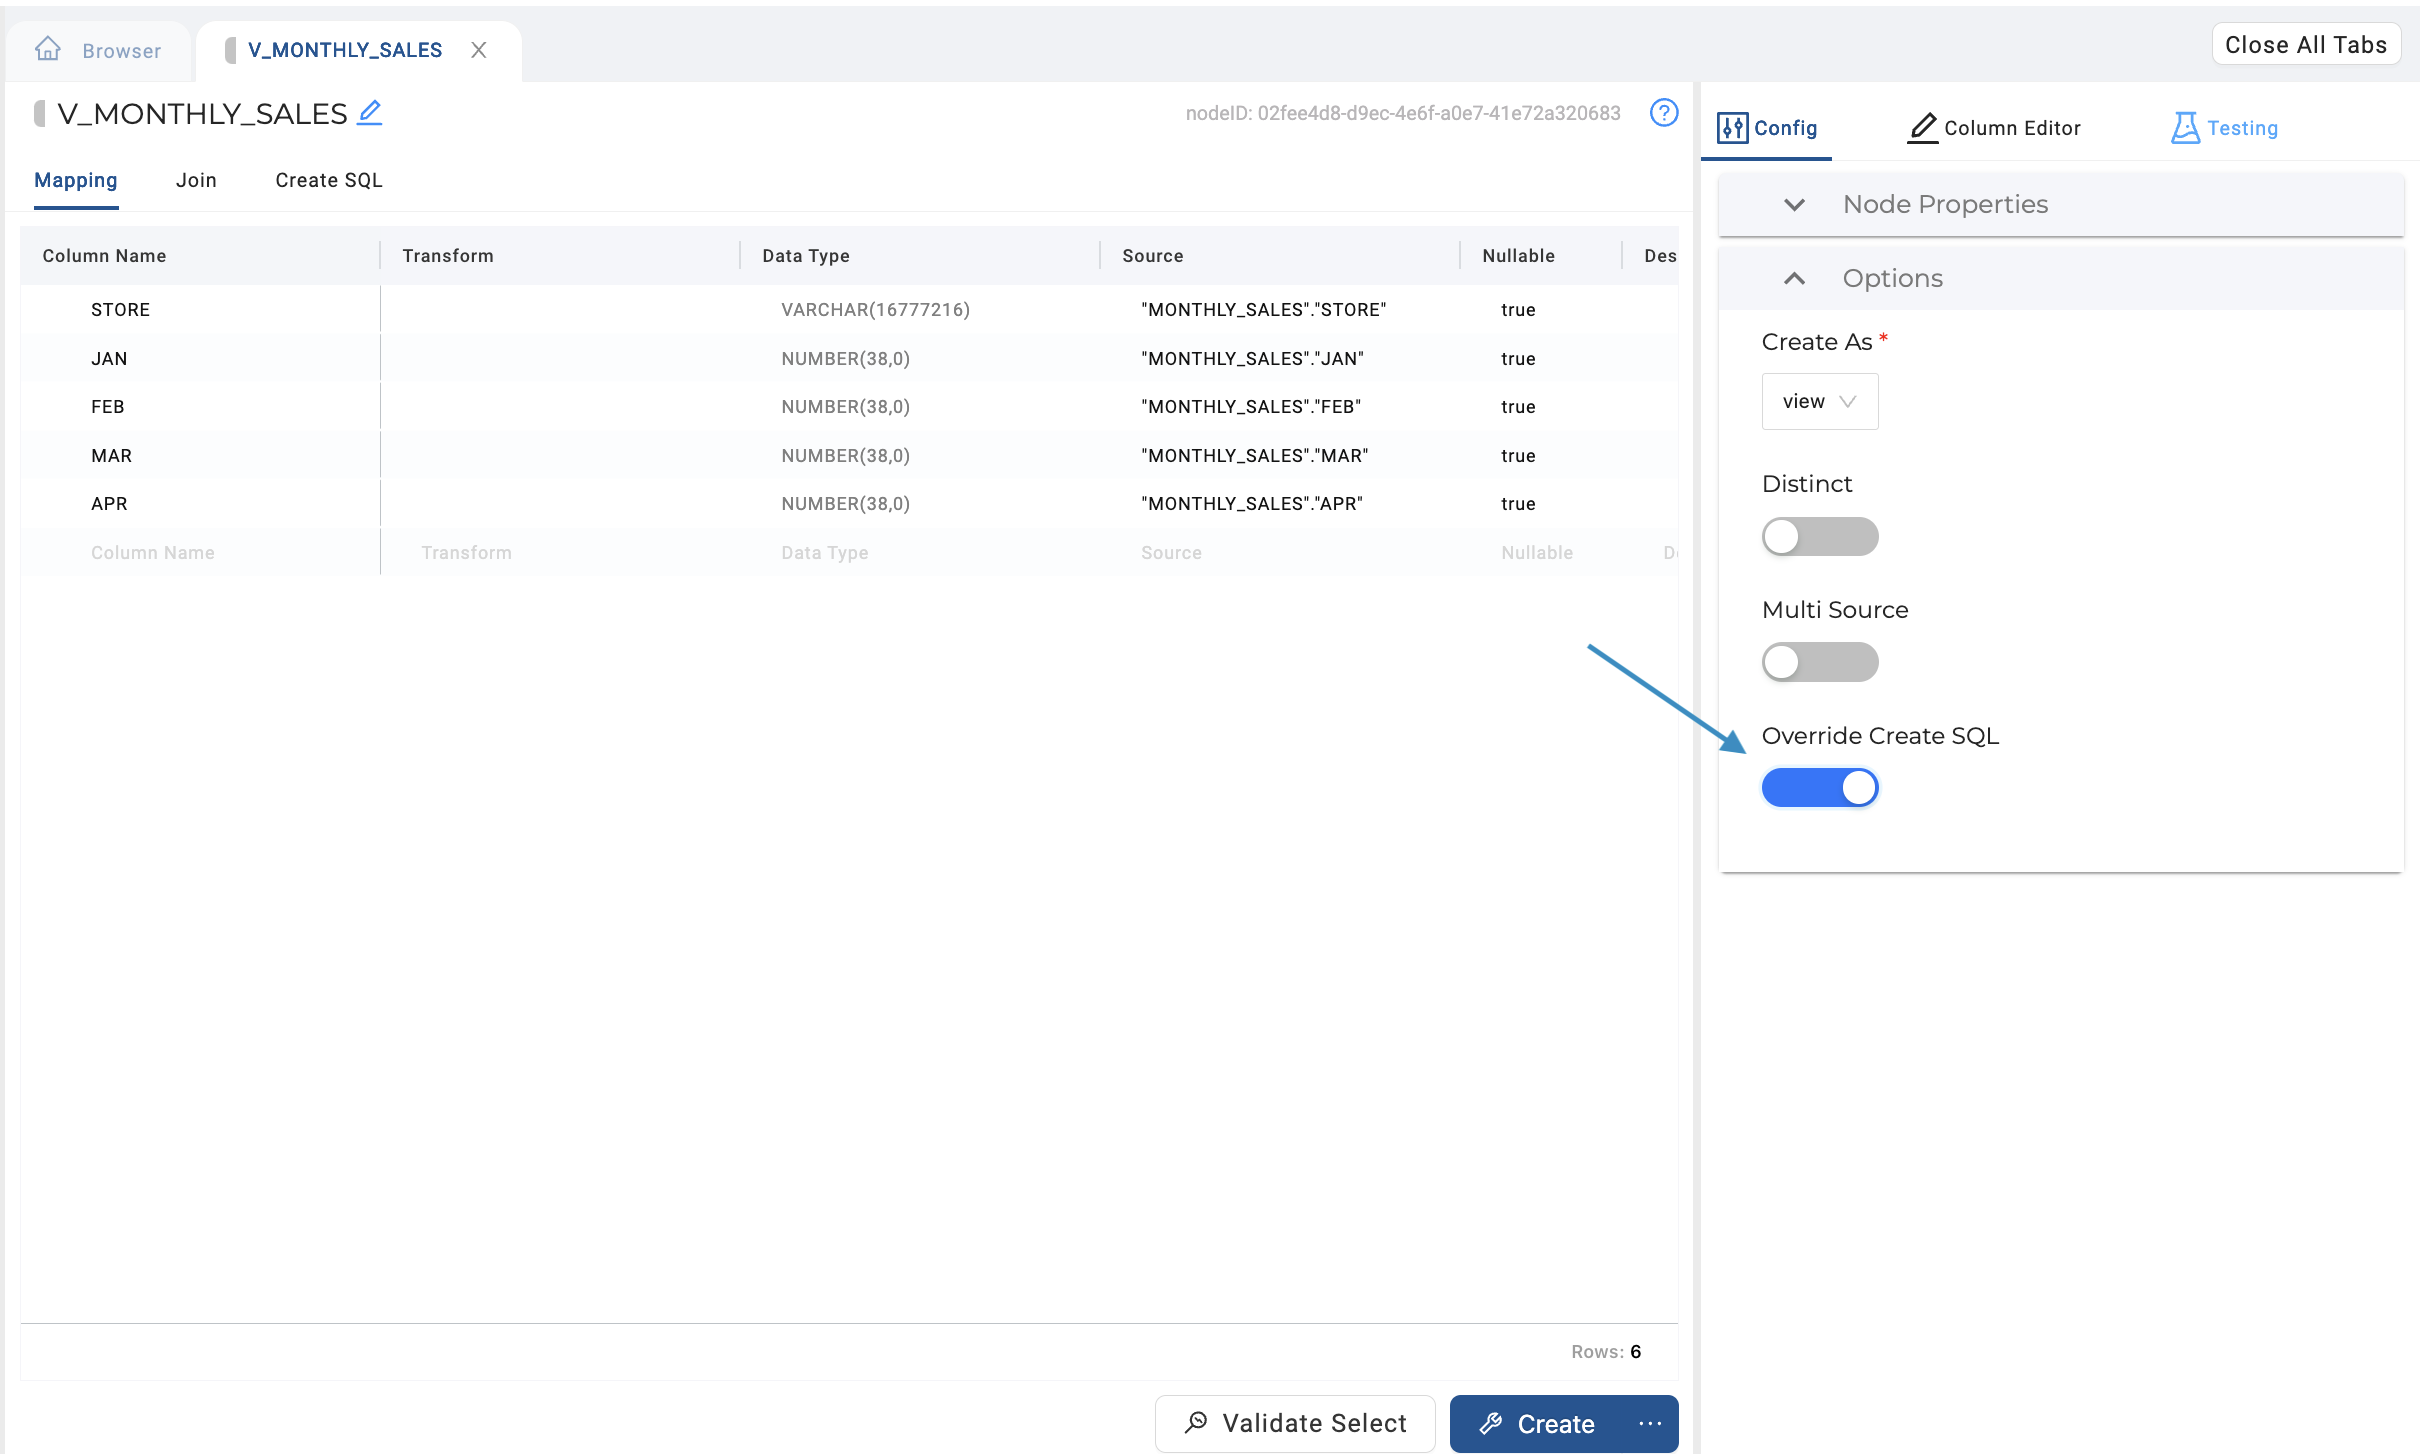
In the View Node’s configuration settings, toggle on the Override Create SQL option.
-
Navigate to the Create SQL tab of the Node Editor, and modify the SQL as follows:
-
Replace the existing column list with asterisk
*. If your SQL is like Figure A, then you can replace your column list with an asterisk*.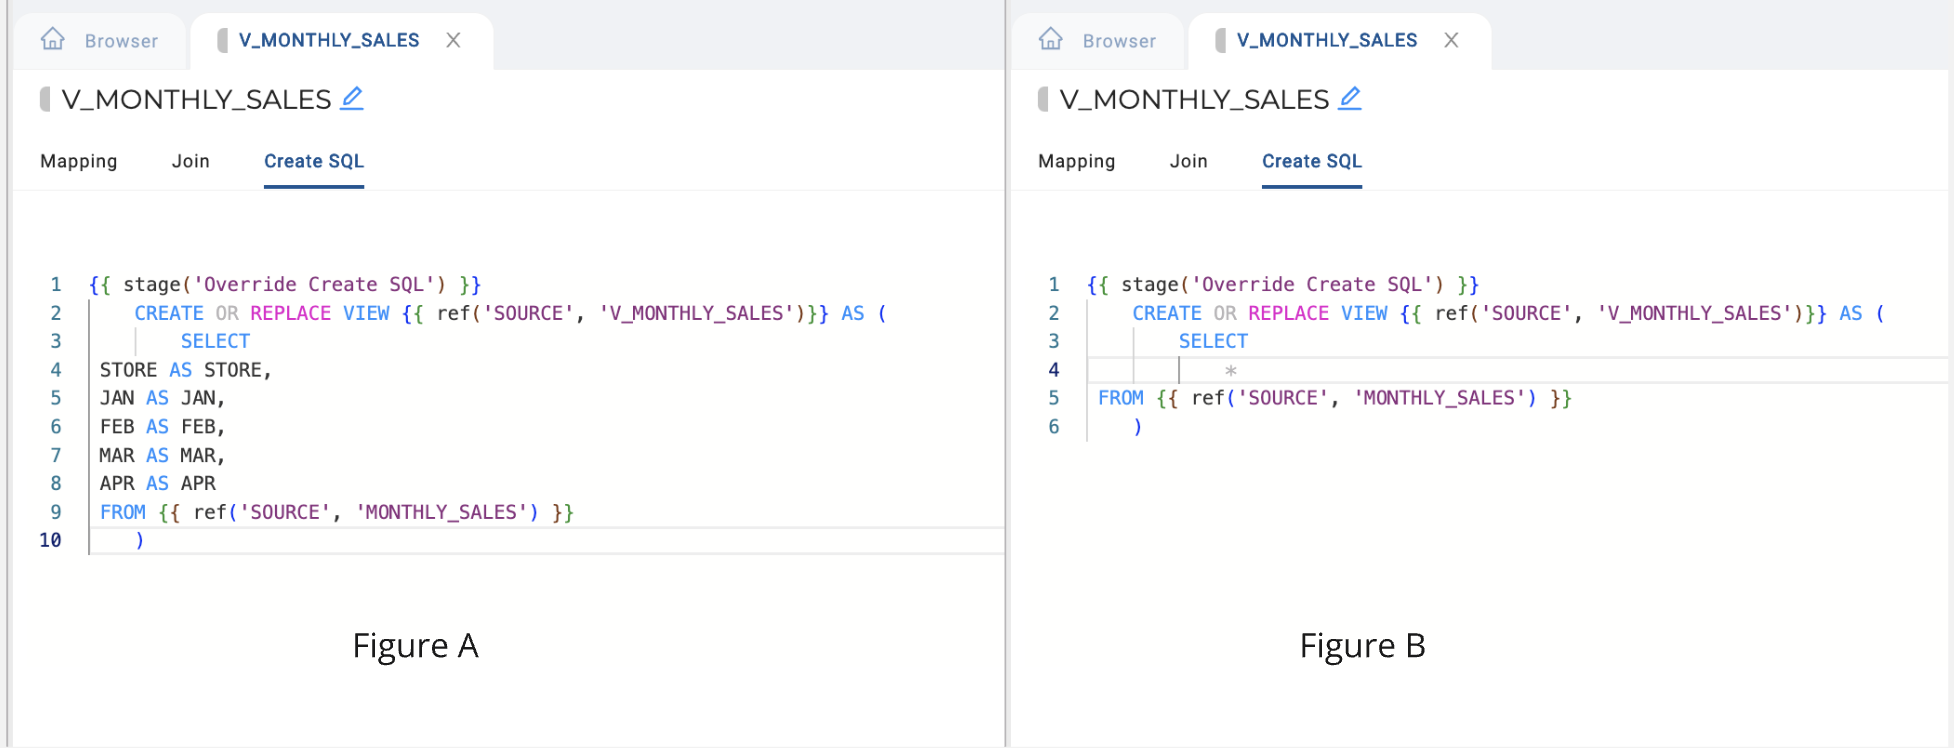
-
Update your join to include your UNPIVOT clause after your FROM clause. For the example detailed above, this UNPIVOT clause would be UNPIVOT(AMOUNT FOR MONTH IN (JAN,FEB,MAR,APR)) as pictured in the example below.
-
-
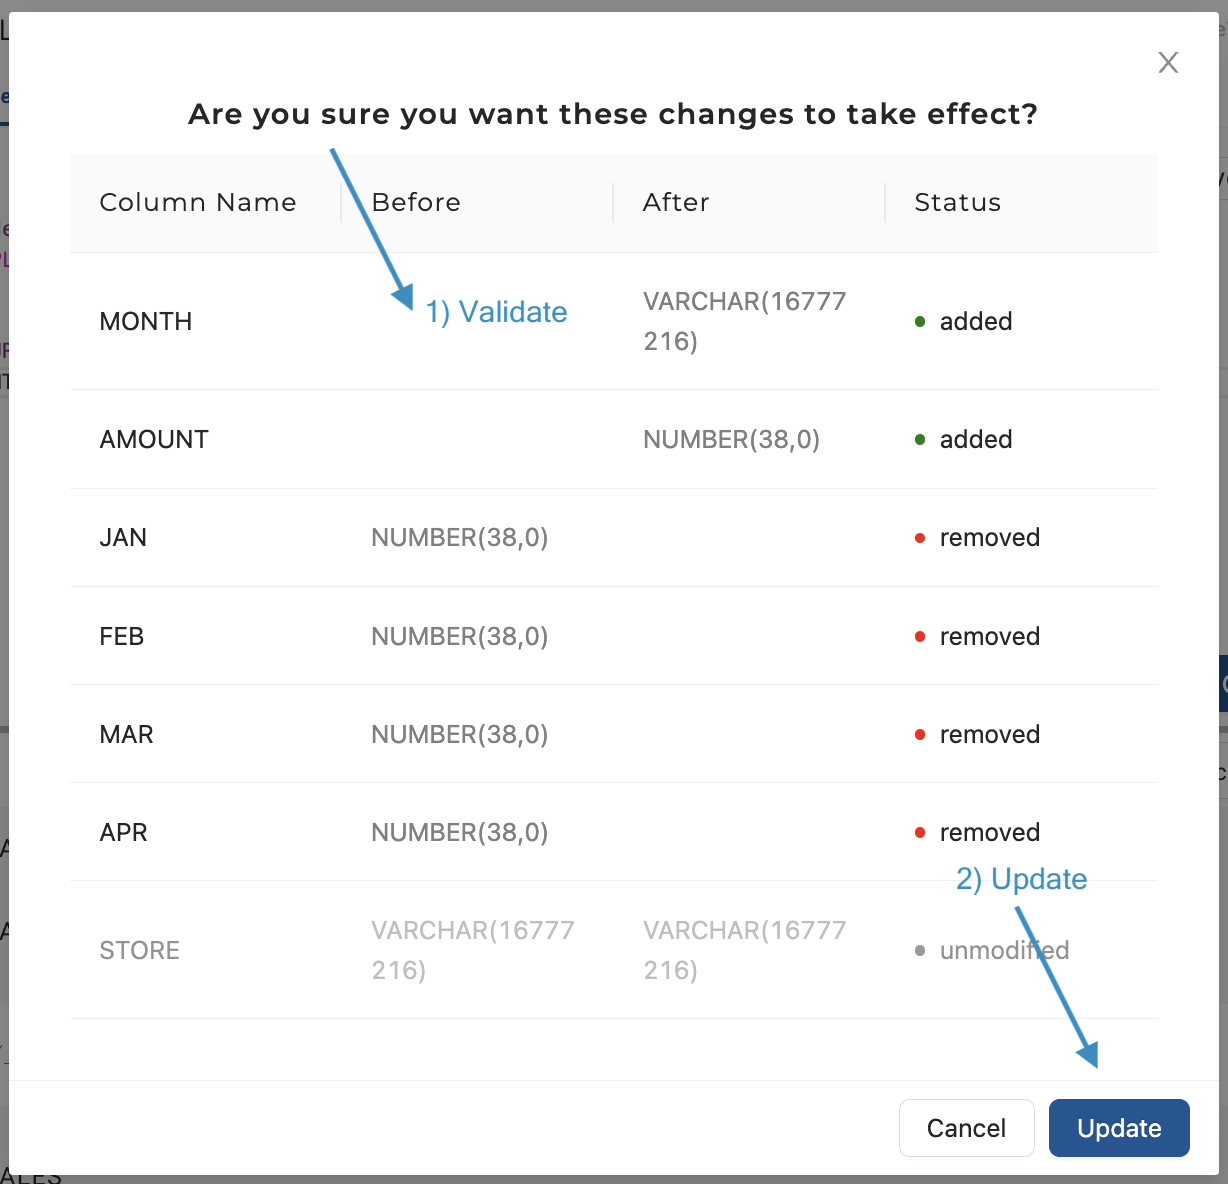
Still in the Create SQL tab of the View Node Editor, click the Derive Mapping button. This will detect the changes between the Node’s current column configuration vs. those found in the Create SQL you’ve input, and ask you to confirm you wish the changes to take effect. If everything looks correct, click Update.
-
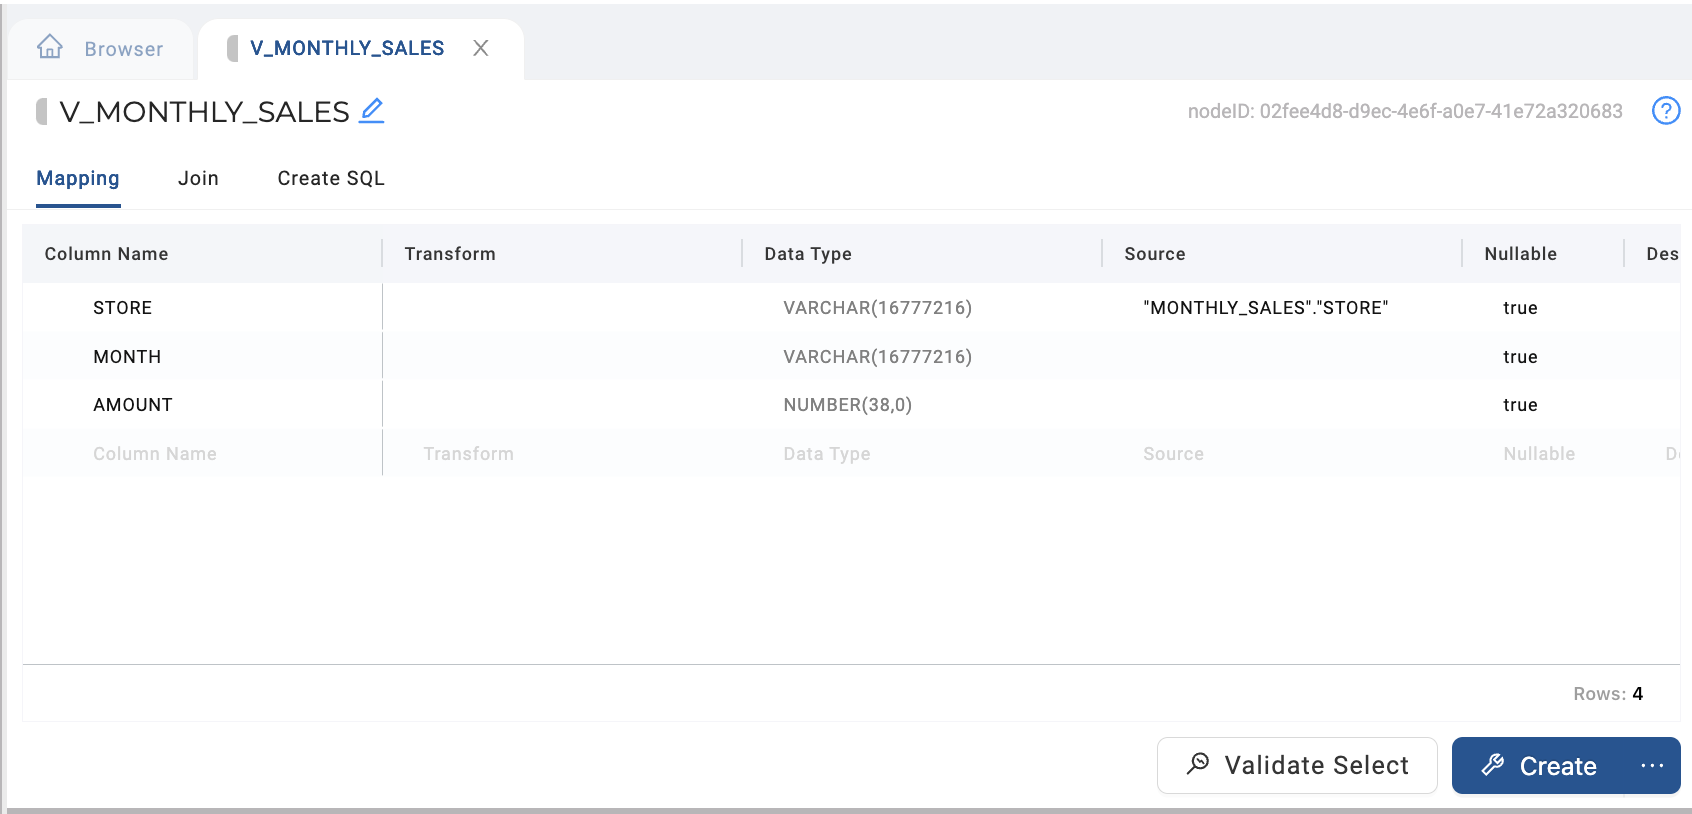
Navigate back to the mapping tab, and confirm the column changes and mappings have taken effect.
-
Within the Node Editor:
- Validate Select.
- Validate Create.
- Create
- Fetch data, and view unpivoted results.
-
Proceed to add the dependent downstream Nodes for your data pipeline, whether it be direct to target or additional processing Nodes. For example: