Documentation index: llms.txt. This page is also available as markdown: append .md to this URL or send Accept: text/markdown.
Lineage
Navigate the lineage graph to understand how your data flows between tables, columns, dashboards, and BI tool models.
What Is Lineage?
Lineage shows how Catalog assets connect so you can trace where data comes from and where it is used.
Where Does Data Come From? Does a Dashboard Use This Data?
Lineage answers many questions. Among them:
- You have found an interesting dashboard, but you want to make sure it uses the right source of data.
- You know a table has the information you need. Does a dashboard already provide analysis for it?
Asset Level Versus Field Level
When we talk about asset-level lineage, we want to understand how tables, dashboards, and BI tool models are linked to one another.
For more specific questions, field-level lineage helps. You can understand data flows at the column and dashboard-field level, for example which warehouse column feeds a report metric or which Explore field depends on a table column.
Field-level lineage depends on what each integration can extract and match. Coverage is strongest when warehouse objects and BI metadata both exist in Catalog and when parsers can resolve stable column or field names. For gaps and recovery steps, see Lineage Troubleshooting.
What Field-Level Lineage Supports
Use this table to set expectations before you open field lineage. Depth varies by technology and by asset type inside the same tool. Always confirm prerequisites on the integration page for your connector.
| Layer | Typical coverage | Notes |
|---|---|---|
| Warehouse tables and columns | Column-to-column lineage from observed SQL and query history | Requires the Warehouse integration to ingest the databases and schemas you care about. Truncated or unsupported SQL can limit column detail. |
| Looker Explores, views, and dashboards | Column-to-field and table-to-dashboard links from LookML plus warehouse metadata | Needs LookML access and warehouse databases that match Looker connection targets. See Looker and Looker sections in Lineage Troubleshooting. |
| Tableau workbooks and published data sources | Column-to-field lineage into workbooks when Metadata API and warehouse objects are available | Tableau Server versions earlier than 2019.3 lack table lineage. Skipping columns or fields during extraction removes field-level detail. See Tableau. |
| Power BI semantic models and reports | Table and column paths through models, and through Dataflows when mashup matches supported patterns | Paginated reports usually show lighter field detail. Measures show dependency paths, not full DAX formula text. See Power BI and Troubleshoot Power BI Lineage When Columns Are Renamed. |
| Sigma workbooks, data sets, and Data Models | Asset-level lineage only | Table-to-workbook and table-to-data set links when Sigma source paths or element SQL resolve to warehouse tables Catalog has ingested. Column- or field-level lineage is not available for Sigma today. See Sigma. |
| Omni workbooks, queries, and dashboards | Asset-level lineage only | Column- or field-level lineage is not available for Omni today. See Omni. |
| Domo data sets, Cards, and Pages | Asset-level relationships among Domo objects, plus column-to-data set field links when data sets are ingested as viz models | Name-matched column-to-field edges stop at the Domo data set. They are not a substitute for field-level or expression-level detail inside a Card. See Domo. |
Other BI tools often show asset-level links to warehouse tables when a Warehouse integration is configured. Field-level depth for those tools depends on what the connector extracts. Start from BI Tools and your tool's setup page.
Dashboards and reports are presentation assets. Semantic models, Explores, published data sources, and similar objects sit between warehouse tables and those presentations. Field-level lineage is often richest on the model or data source layer. If field lineage looks empty on a dashboard, open the related model, Explore, or data source and try field lineage there.
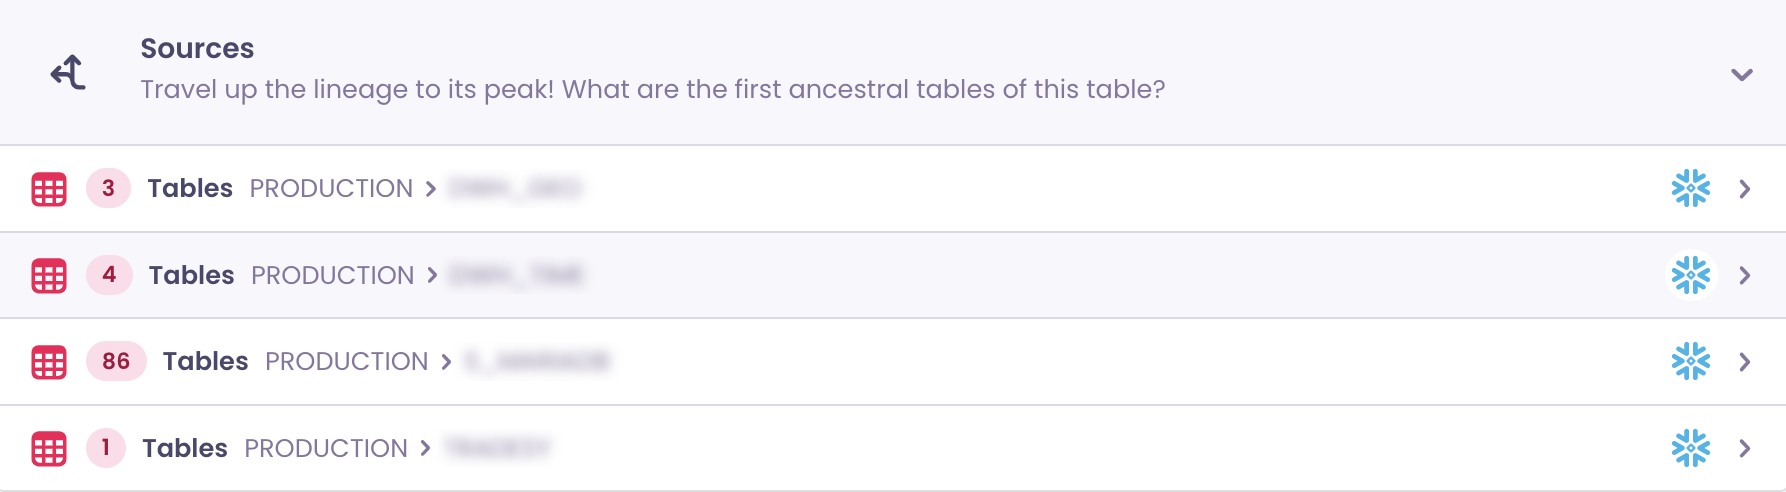
Sources
Ever wondered which tables are the ancestors of a table or dashboard?
Sources travels up the lineage to the first ancestral elements.
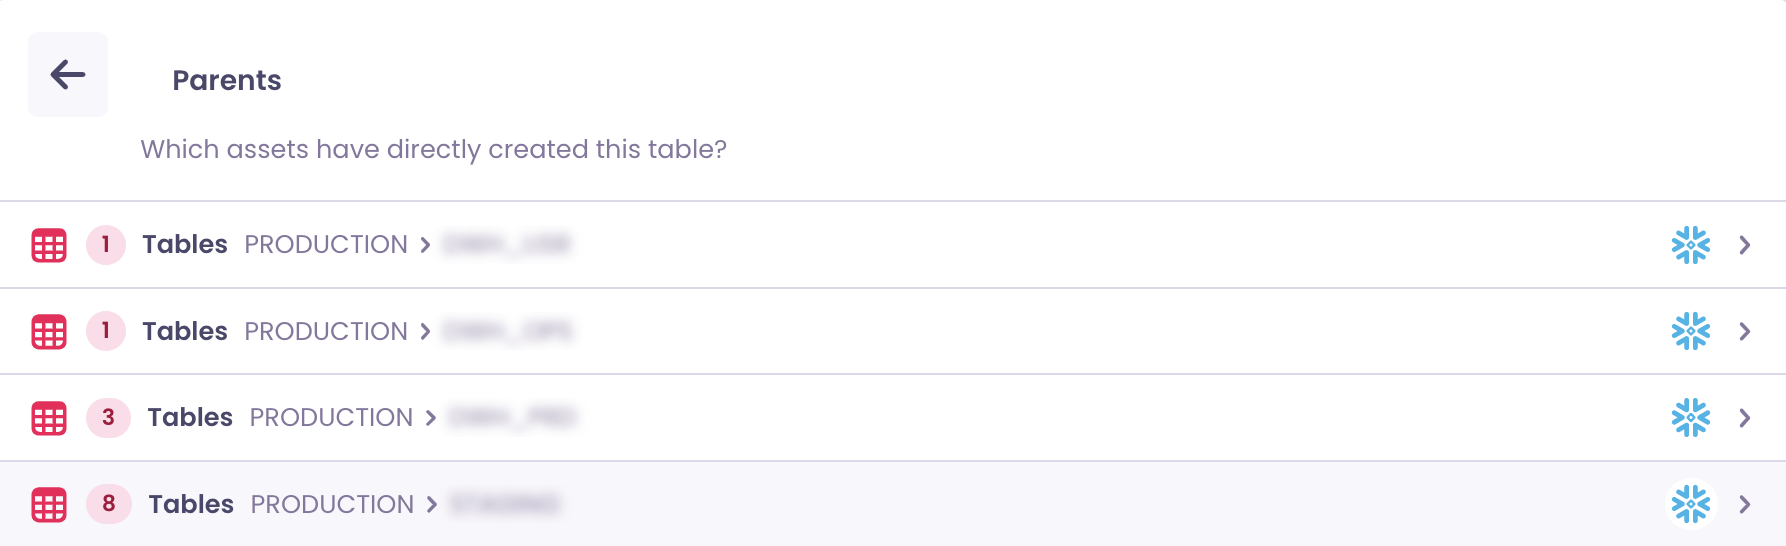
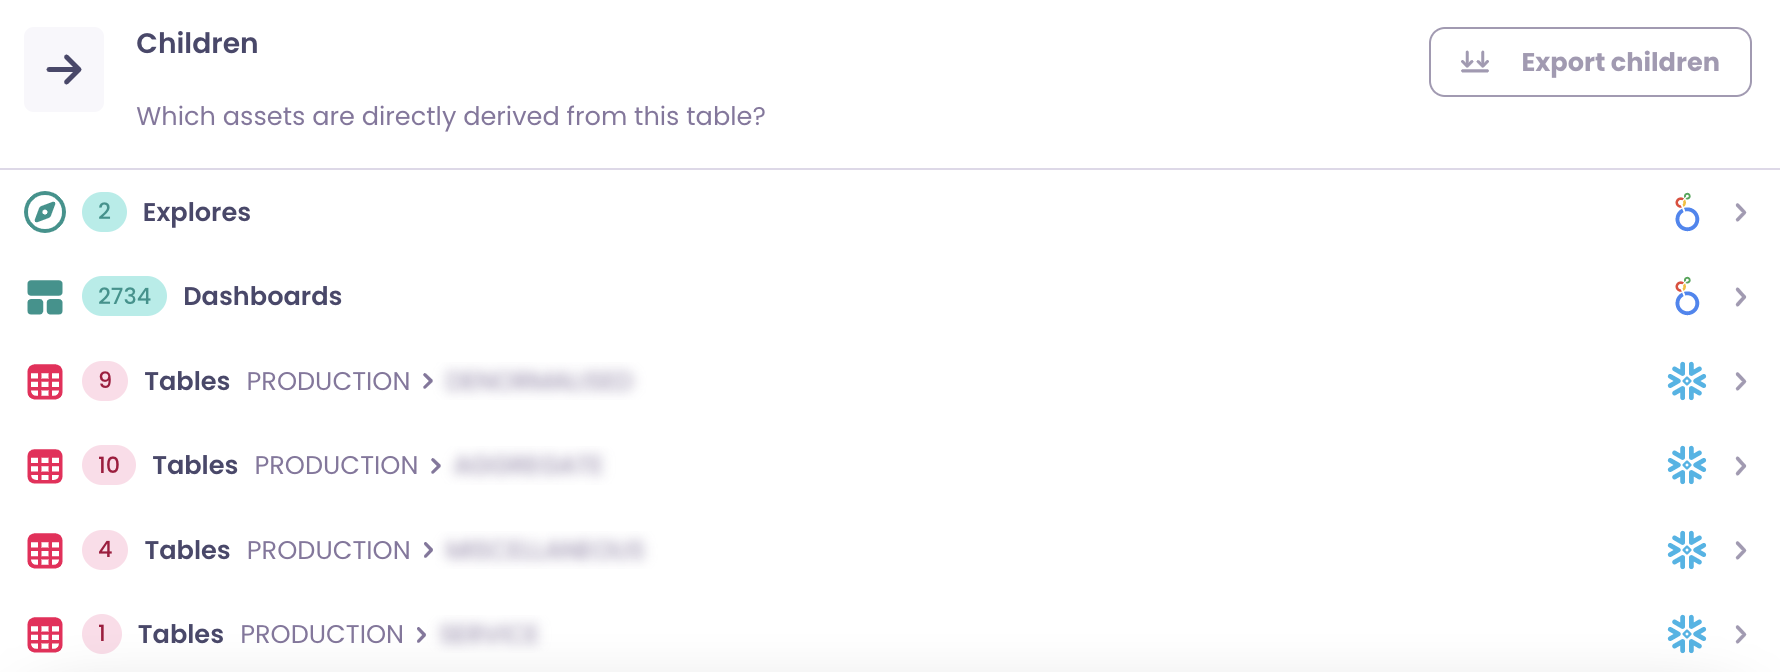
Parents and Children
Find out which tables and dashboards are directly related to your tables upstream and downstream.
Click Export Children to export and download all lineage children in a CSV file.
Lineage Graph
Use the lineage graph to expand only the upstream and downstream paths you need, so the view stays clear.
In Catalog, start from a focused set of assets, then expand to get the information you need.
Going Downstream
You need to make a modification to a table and check the impact? Or check where a table is used?
Click + on the right of any table in the lineage graph to discover assets created from the selected one.
Going Upstream
You need to troubleshoot a problem in a table? Checking where the data comes from is always a good idea.
Deep dive into the origins of the data by clicking the + on the left of a table.
Dashboards and Tables
Dashboards and tables come from different technologies. Understanding the link between them is not straightforward.
Catalog can help. Full links between tables and dashboards can be established with the lineage graph.
Open Field Lineage
On tables, choose a column and open column or field lineage when that control is available. On dashboards, reports, or visualization models, use Open Field Lineage or the equivalent field picker on the Lineage tab when your integration supports it.
Field lineage only connects assets Catalog has already ingested. If coverage looks incomplete, see Prerequisites for Cross-Tool Lineage.
Lineage Graph Refresh
Every time your data is synchronized into Catalog, the lineage is refreshed. The lineage graph displayed in Catalog uses data from the last 30 days.
Stale Links in the Graph
If you still see old links in your graph, update the lineage time range so you can view lineage computed on less than 30 days and see the impact of your recent SQL changes.
BI tools refresh on their own schedule. After you change LookML, republish a Tableau workbook, or refresh a Power BI model, wait for the next successful Catalog extraction of both the BI tool and the related Warehouse integration before you judge field lineage. First Catalog-managed BI syncs can take up to 48 hours.
Prerequisites for Cross-Tool Lineage
Field-level links between a warehouse and a BI tool need both integrations healthy and in scope:
- Configure a Warehouse integration that ingests the databases, schemas, and tables your BI content uses.
- Configure the BI integration for your tool under BI Tools, including any LookML, Metadata API, Admin API, or credential prerequisites on that page.
- Confirm both sources show a successful run under Settings > Integrations.
- Open asset-level lineage first to confirm table-to-dashboard links, then drill into field lineage for a specific column or field.
If either side is paused, filtered out of ingestion scope, or pointing at a database Catalog does not ingest, field-level edges can disappear even when the BI tool itself still works.
What's Next?
- Resolve missing columns, stale BI lineage, and cross-connector gaps in Lineage Troubleshooting.
- Review setup for your connector under BI Tools.
- Trace metrics and dashboards end to end in Trace Metrics and Dashboards in Catalog.