Documentation index: llms.txt. This page is also available as markdown: append .md to this URL or send Accept: text/markdown.
Organizing Your DAG
A well-organized DAG is essential for building maintainable and scalable data pipelines in Coalesce. This guide will help you effectively organize your DAG using graphs, subgraphs, and filters to improve visibility and manageability.
For Subgraph naming, editing, when to add another Subgraph, and how Subgraphs work with Jobs and version control, see Using Subgraphs to Build Your Pipeline.
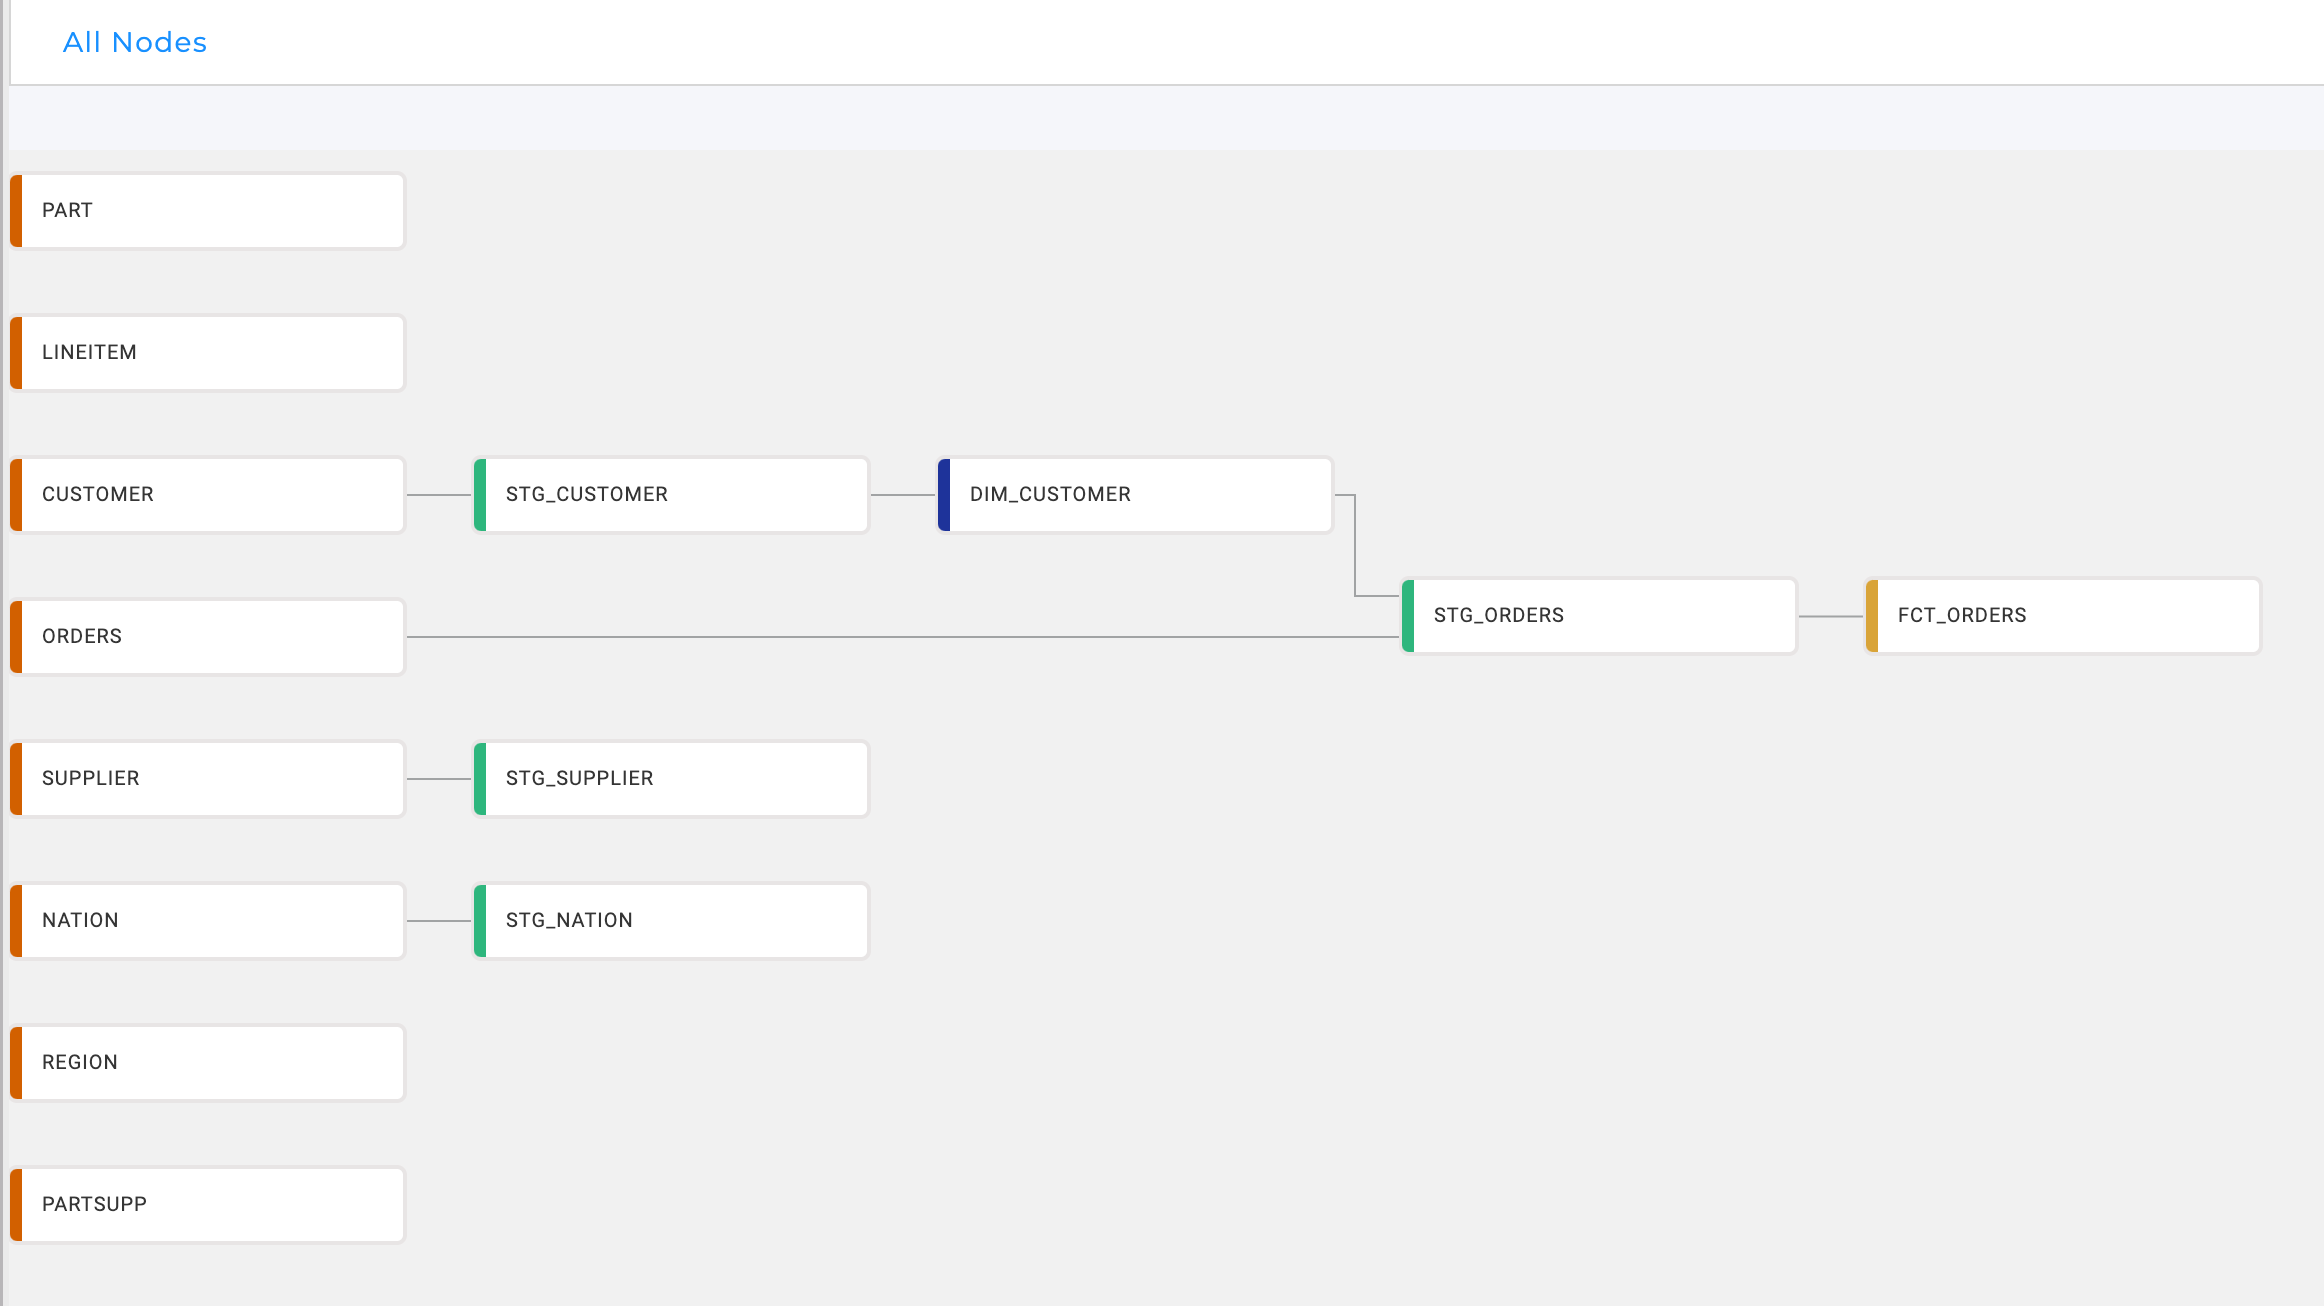
Main Graph View
The main graph shows your entire DAG with all Nodes and connections.
Subgraphs
Subgraphs allow you to view specific parts of your Node graph in isolation, breaking down your pipeline into smaller segments.
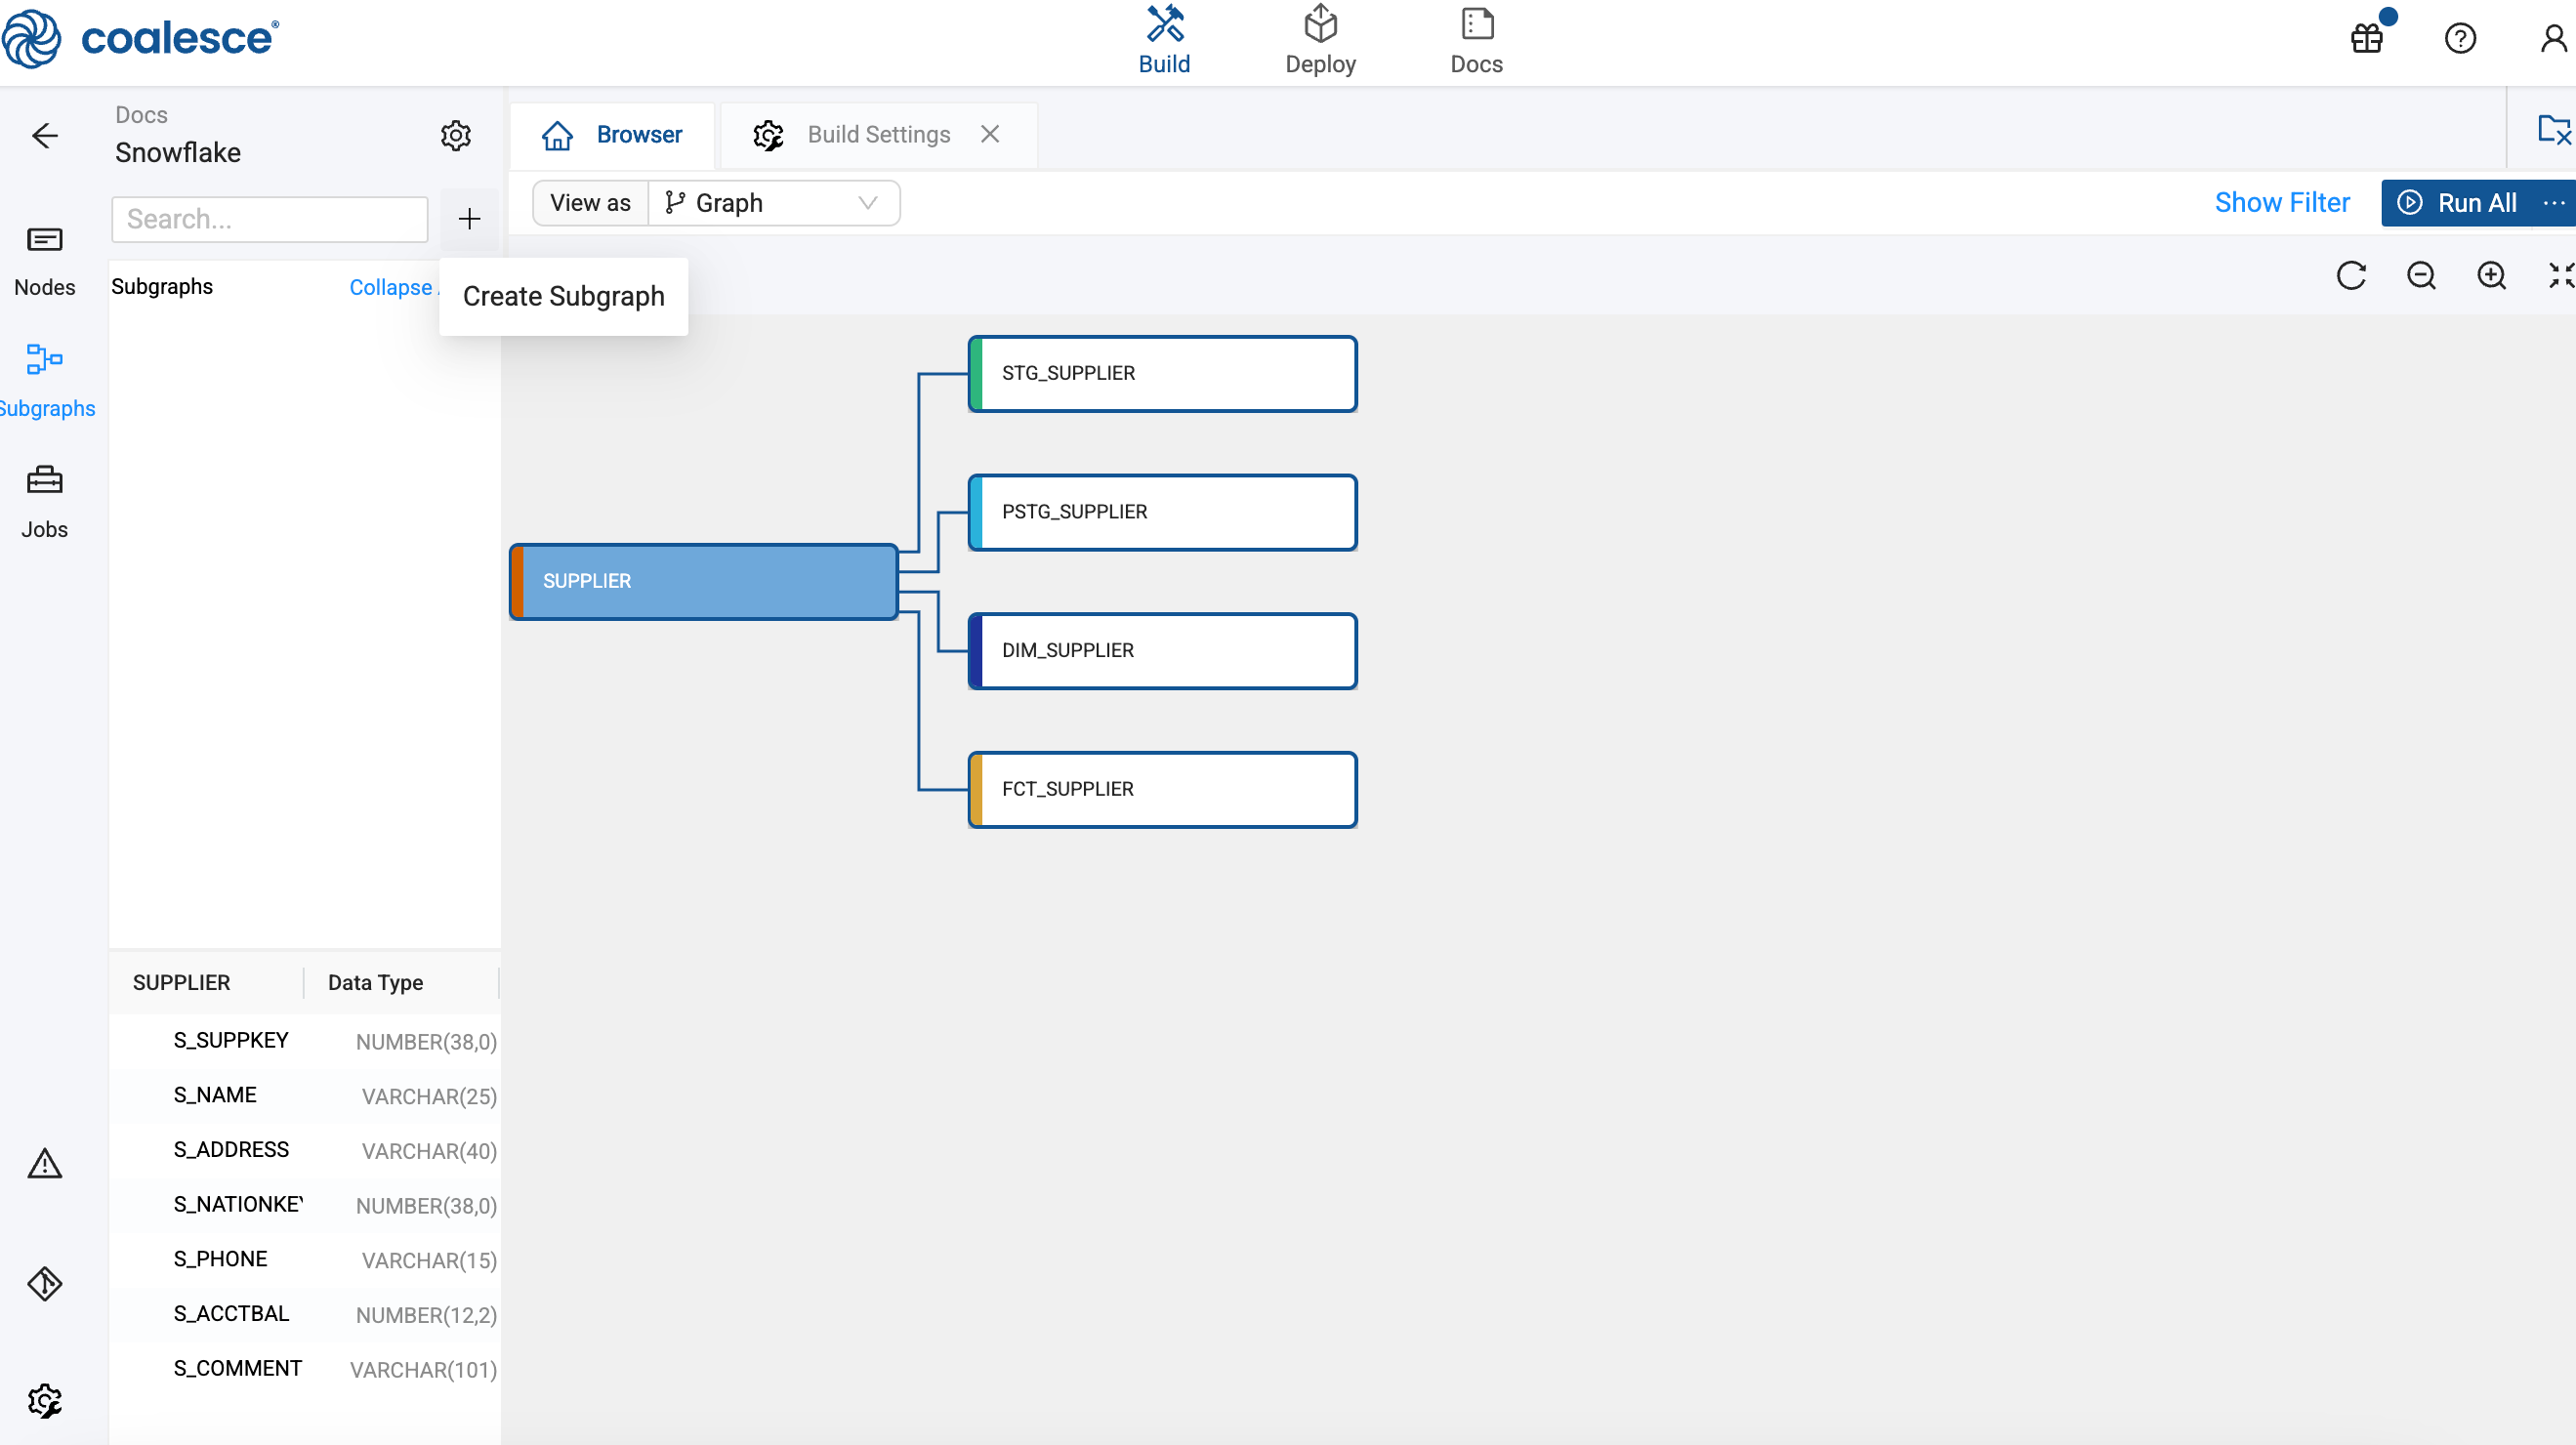
To create a subgraph:
-
In the Build Interface, click on Subgraph, then click the plus sign (+) to add a new subgraph.
-
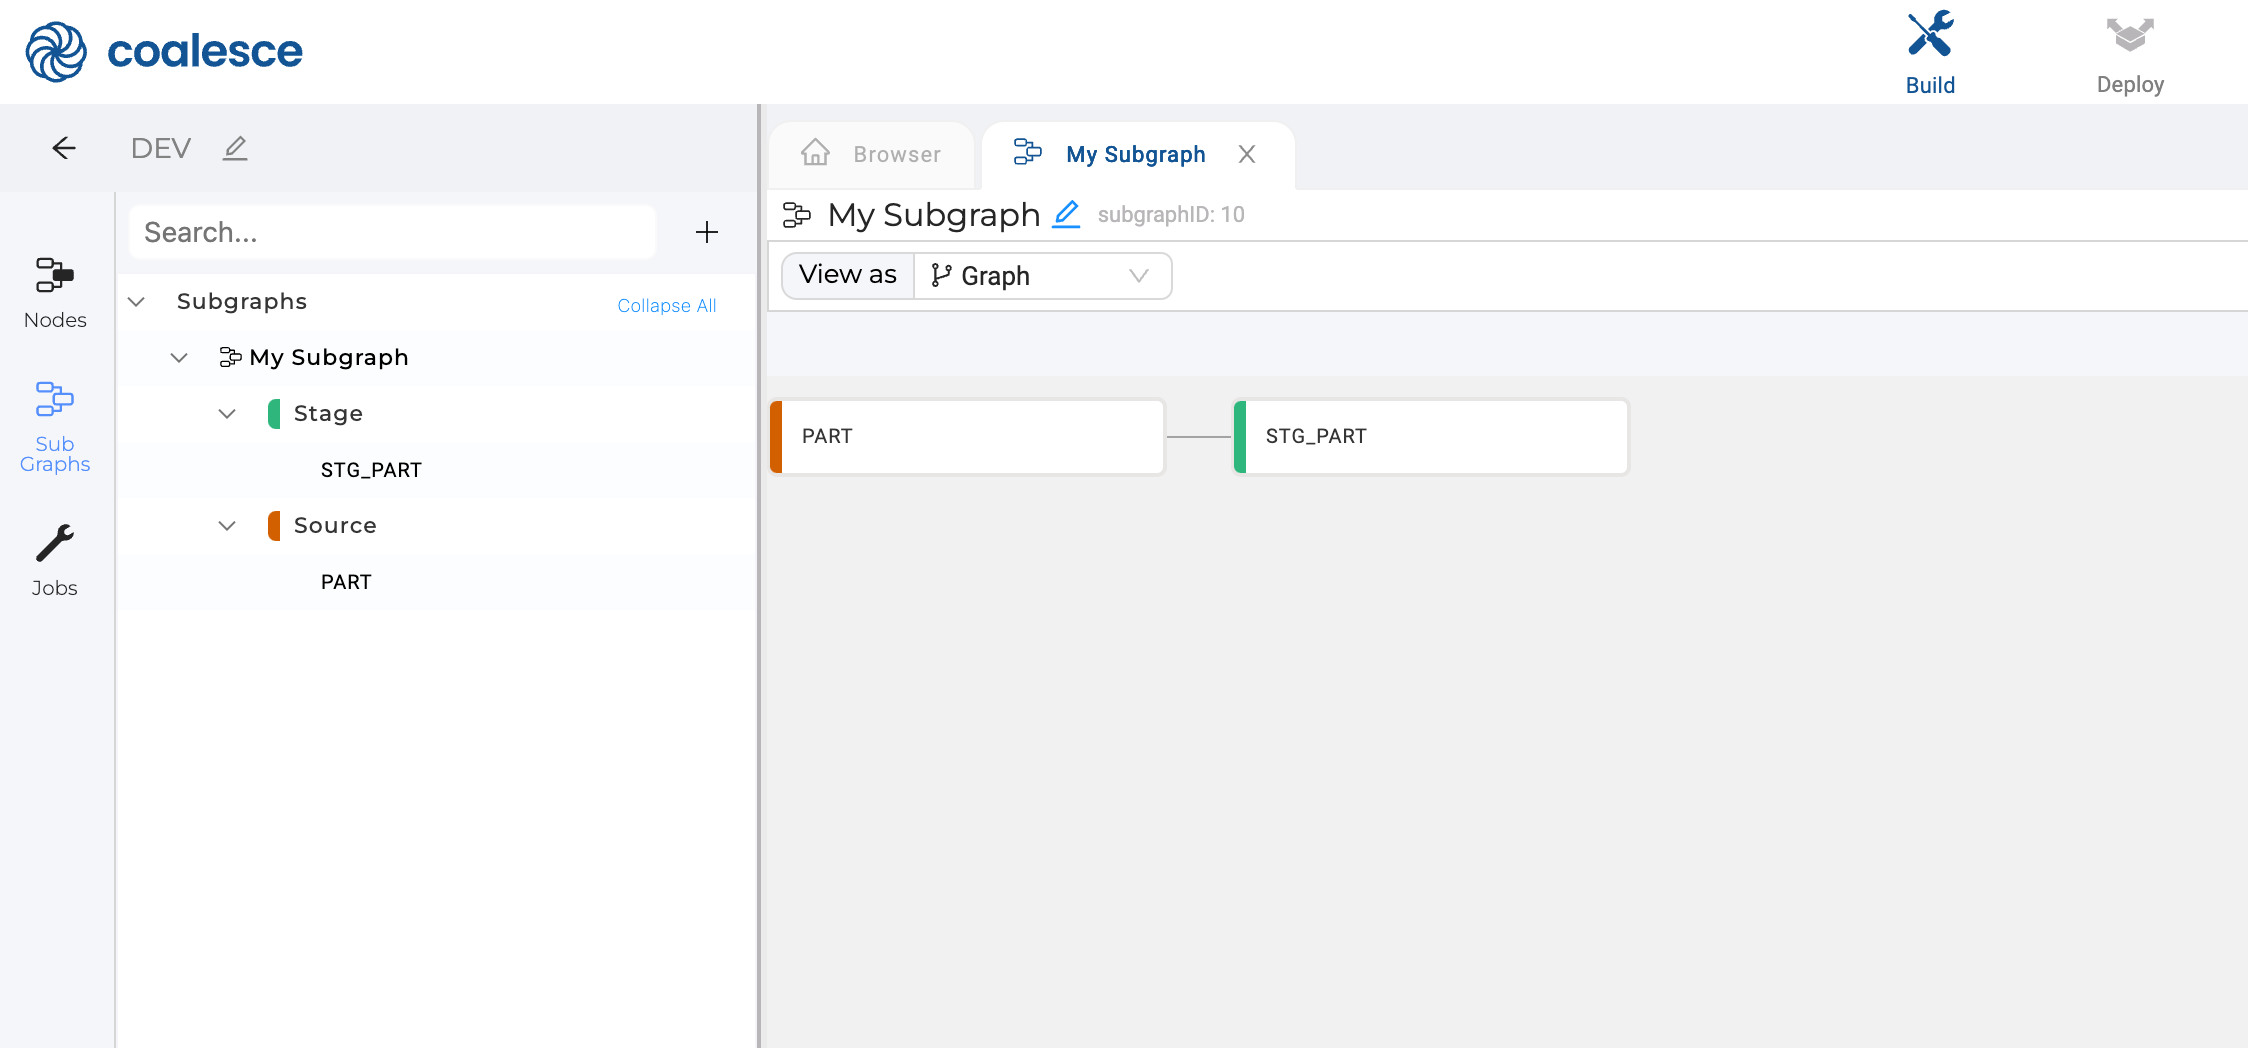
Click on the new subgraph which will take you to an empty DAG.
-
Update the subgraph name to something descriptive.
-
You can add Nodes by click on Nodes and then dragging them into the subgraph, or right-click a Node and select Add to a Subgraph.
When you add a Node to a subgraph, you're creating a reference to the original Node. This means:
- A Node can exist in multiple subgraphs.
- Changes to a Node in one subgraph are reflected across all instances.
- Dependencies between Nodes are maintained across subgraphs.
Adding Nodes to the Subgraph
Nodes can be added to existing subgraphs in two different ways:
- Using Add to Subgraph from the context menu.
- Dragging and dropping nodes into an existing subgraph. This is supported in Graph, Node Grid, and Column Grid views.
Use filters in the Node view to limit the number of Nodes and make it faster to select them for the subgraph.
Change the View
You can also change the view in subgraphs by selecting an option from View As.
- Graph: Shows the visual representation of Nodes and connections.
- Node Grid: Displays nodes in a table format for bulk editing.
- Column Grid: Shows all columns across nodes for inspecting dependencies.