Documentation index: llms.txt. This page is also available as markdown: append .md to this URL or send Accept: text/markdown.
The Build Interface
The Build Interface is where you'll spend most of your time creating nodes, building graphs, and transforming your data.
For how Mapping, the Join tab, and graph actions work together when dependencies or lineage look wrong, see Managing Dependencies in the Node Editor.
DAG or Graph View
A graph represents a SQL pipeline. Each node is a logical representation and can be materialized as a table or a view in the database. Currently, you can add the following out-of-the-box types of nodes: Source, Stage, Persistent Stage, Dimension, and Fact. You can also create their own Node Types.
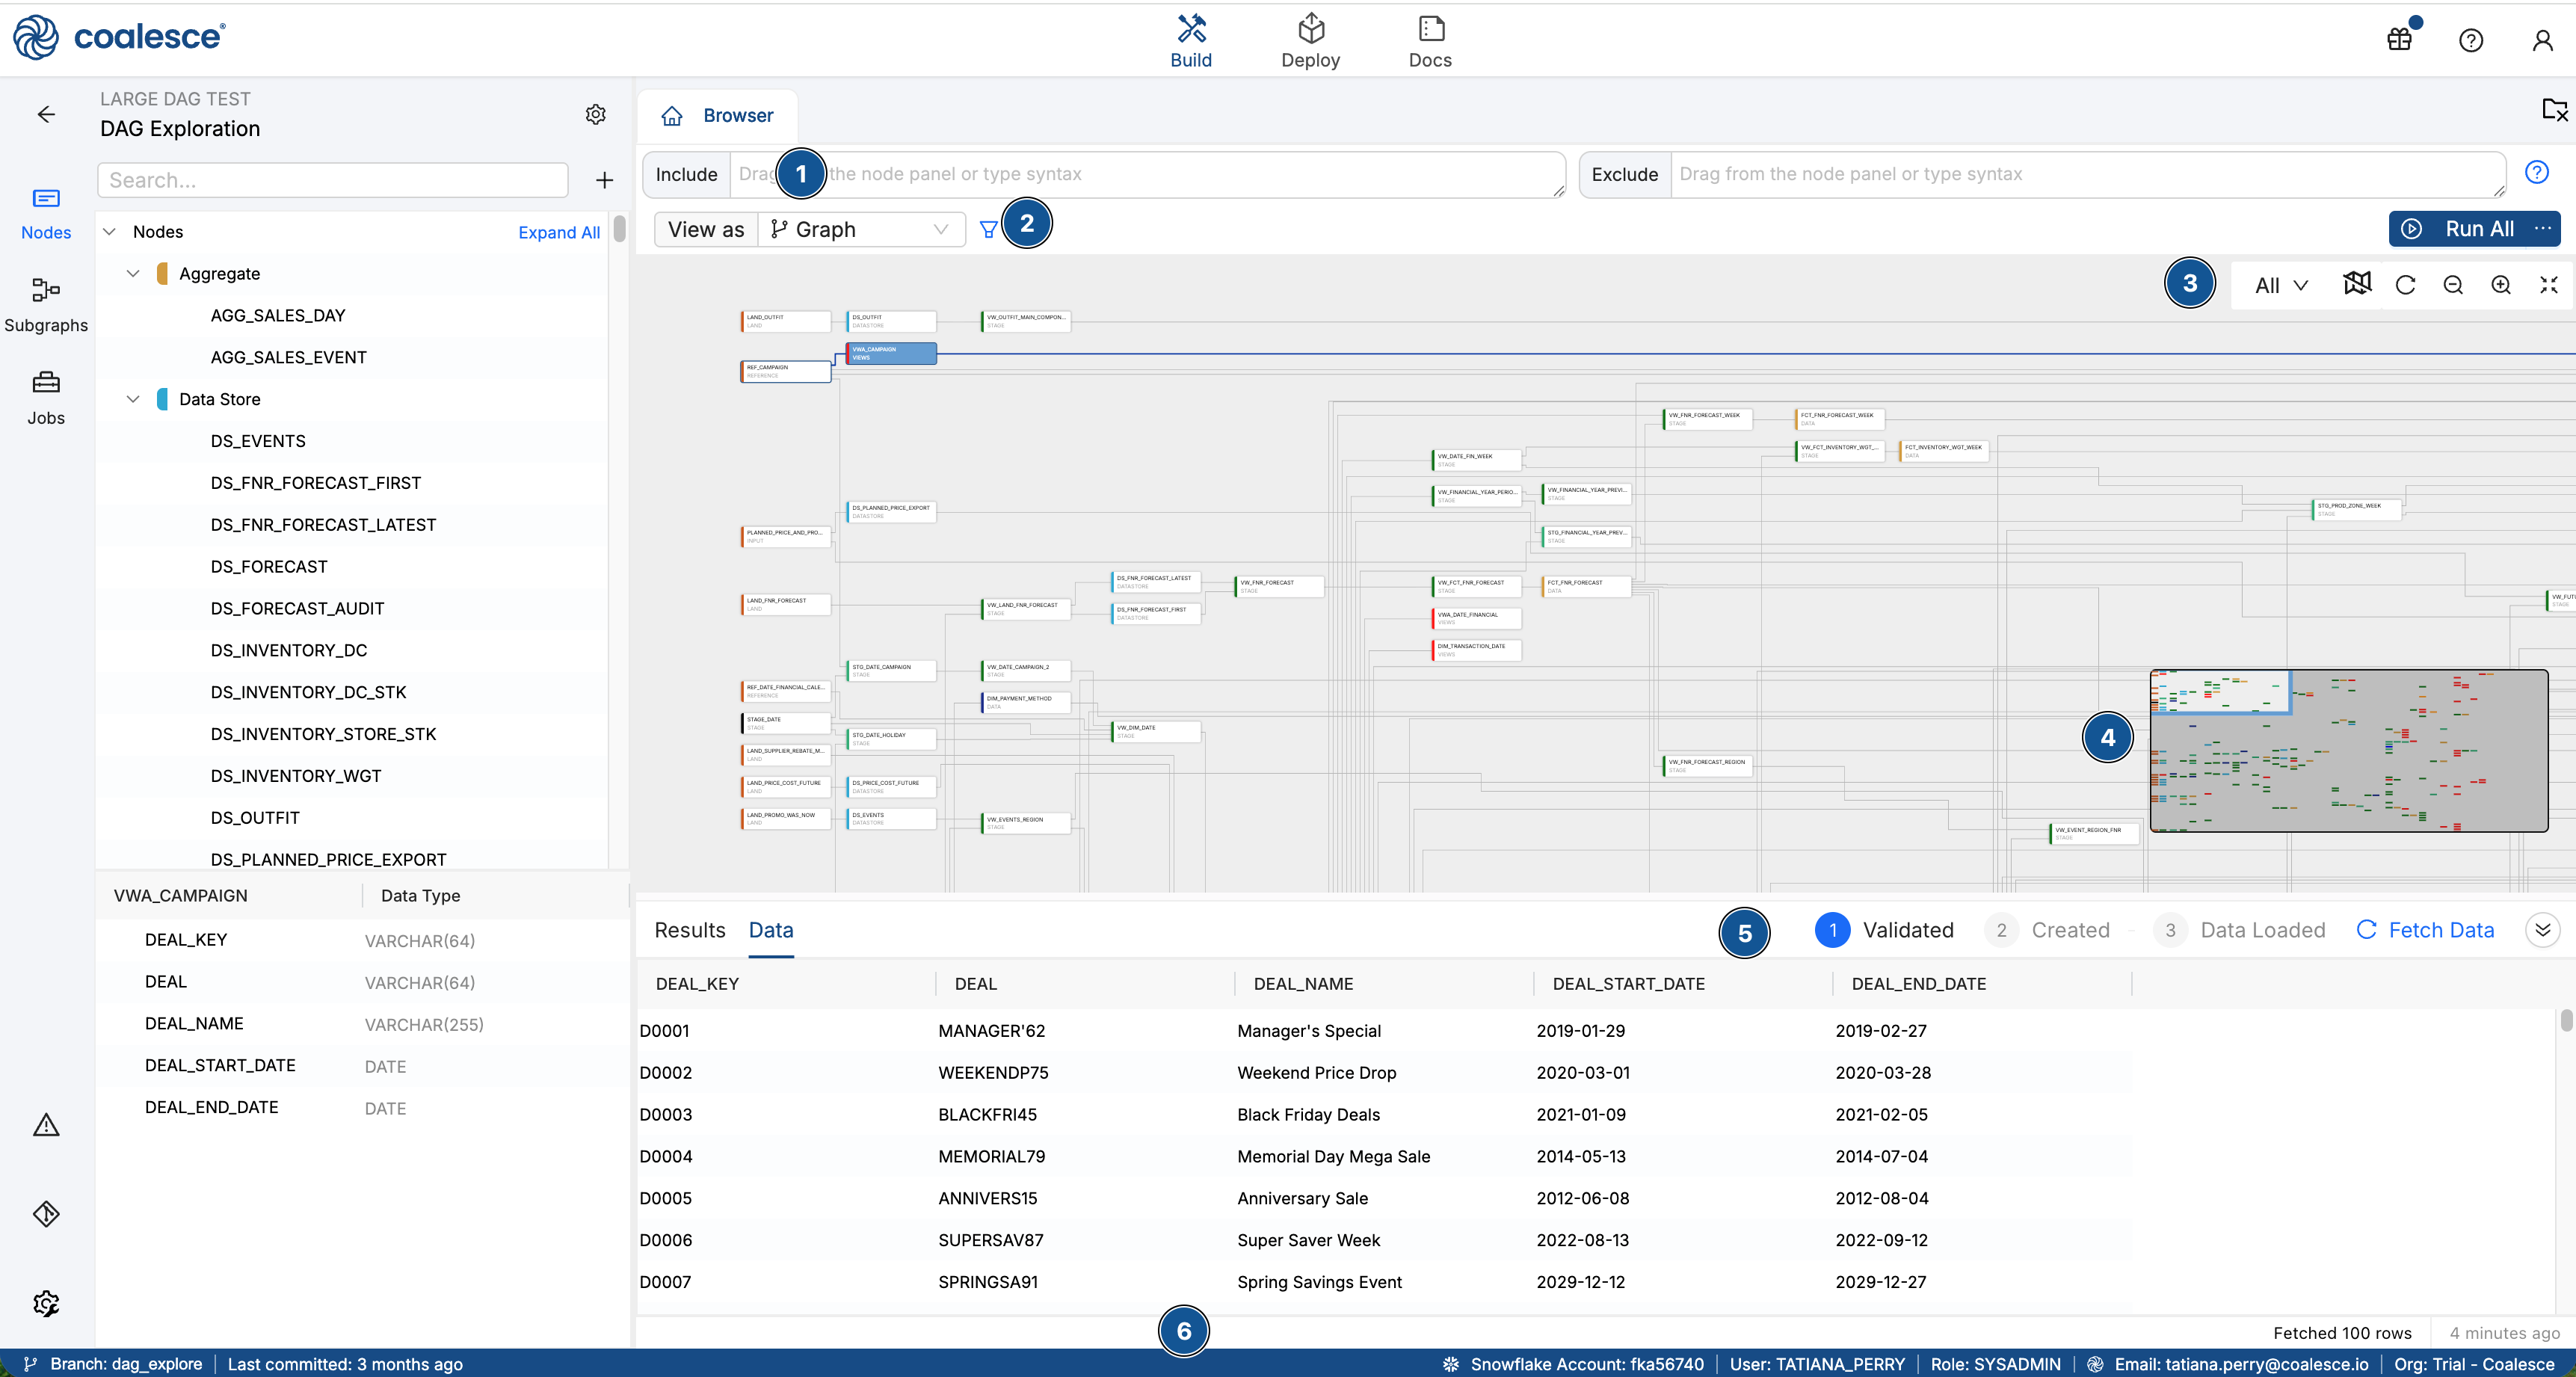
- Include and exclude - Click and drag Nodes into the filters to either include or exclude Nodes from the Graph view.
- Filter and dropdowns - Add filters to only show the Nodes you want to see. Change the dropdown to:
- Graph - Shows the DAG.
- Node Grid - A table style list of Nodes. Use bulk Node editor from this view to change Node Type, Deploy Enabled, or Storage Location.
- Column Grid - A table style list of all the columns in all the Nodes. You can bulk edit or view Column Lineage. Right-click on a column to view all available options.
- Node View Options
- All - View all Nodes
- Upstream - Shows all Nodes that feed into the selected Node.
- Downstream - Shows all Nodes that depend on the selected Node.
- Related - Shows both upstream and downstream Nodes for the selected Node.
- Spotlight - Shows both upstream and downstream Nodes up to four levels deep.
- Mini Map - The mini map shows a view of the entire graph and highlights your current view port so you can jump quickly to any area.
- The mini map reflects filters so what you see always matches your current Graph view.
- Colors in the mini map match Node type colors in the Graph View for quick orientation.
- Drag the DAG to see the mini map view port change.
- Results and Data Pane - This section provides the user with feedback as to exactly what SQL was queried and the ability to preview the data results within the application. See the status of your run. Validated, Created or Data Loaded.
- Footer - The footer contains the branch the Workspace is attached to, the last commit made, the data platform name, user name, user role in the data platform, user email address, and organization name.
Build Interface Sidebar
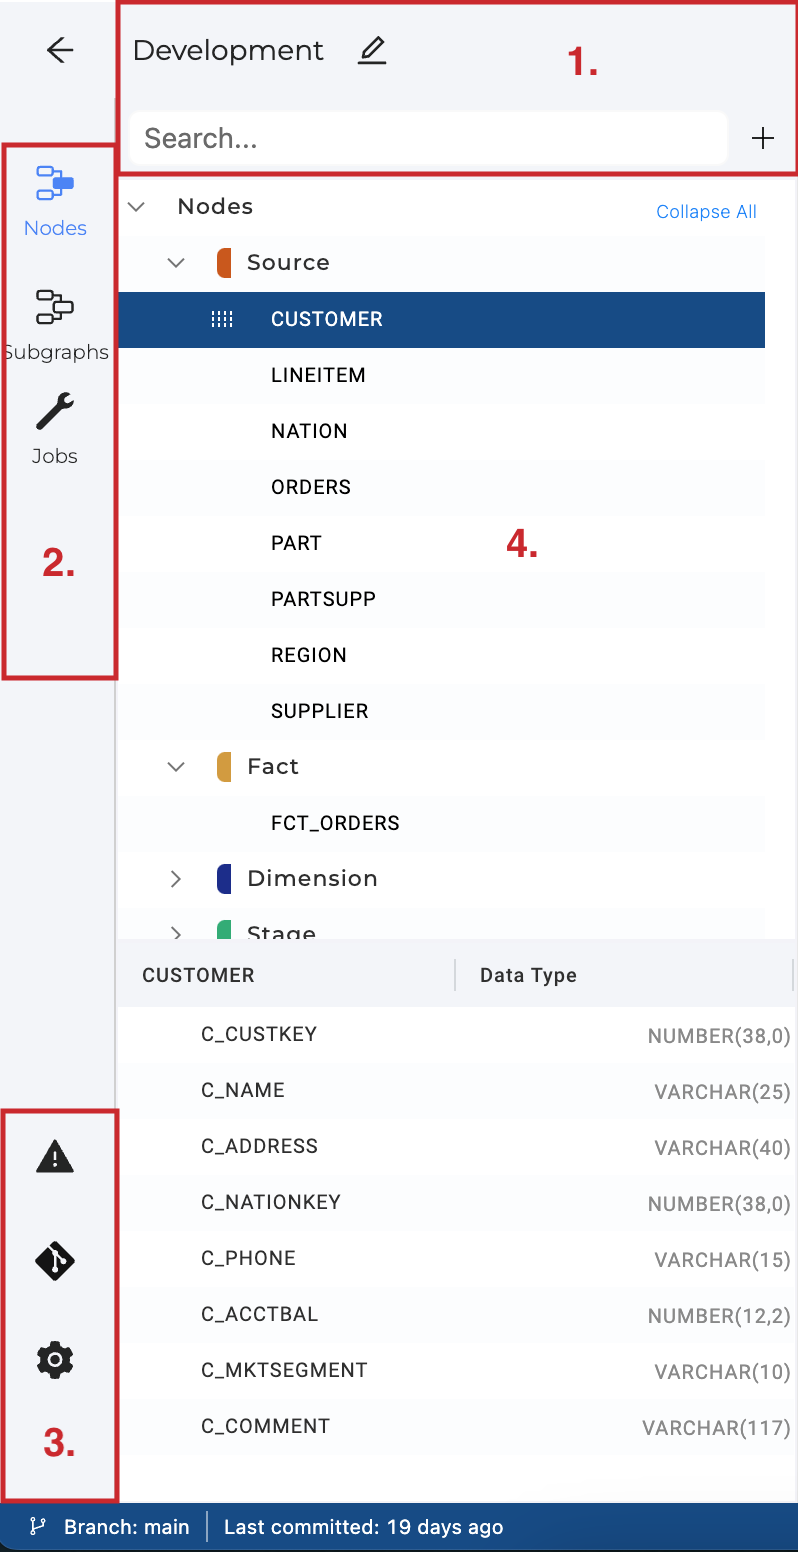
- Workspace name - The name of the workspace you're working in.
- Search bar - Search the node name.
- Click the plus sign to Add Sources(data) or Create a New Node(add an existing node type to the DAG).
- Categories - Change the category to:
- Nodes, the default
- Subgraphs (see Using Subgraphs to Build Your Pipeline for workflows)
- Jobs
- Other Options
- The Problem Scanner - List problems with the current workspace.
- Git - Shows working branch, commits, and code differences.
- Build Settings - Opens a tab with the Build Settings.
Browser
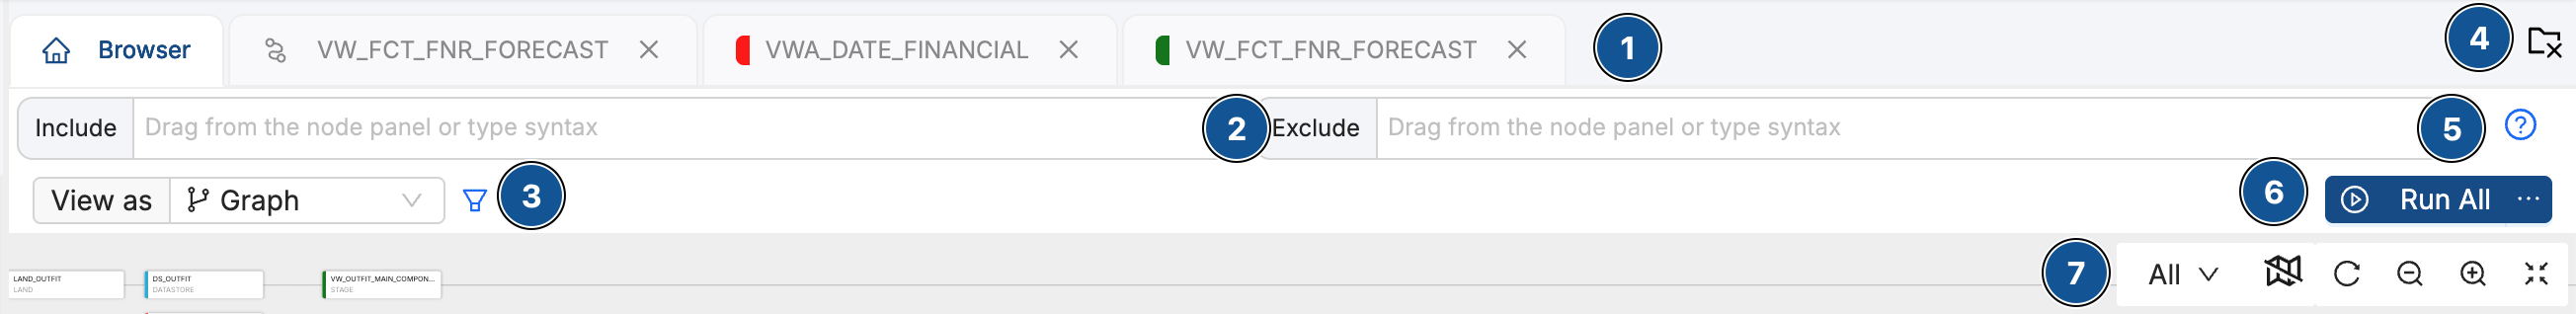
- Tabs - Any nodes you have open including column lineage.
- Include and Exclude - The filter that enables Selector syntax to be used. Drag and drop Nodes into the view or type in selector syntax.
- View as - Change the way you view the Node Graph.
- Graph
- Node Grid
- Column Grid
- Close - Close all tabs.
- Selector - A tooltip showing available search syntax.
- Run All nodes. You can also:
- Validate all Nodes.
- Create all Nodes.
- Validate create all Nodes.
- Node Graph Controls:
- Change the Node view options.
- Toggle the mini map
- Reload or refresh the Graph positions.
- Zoom out
- Zoom in
- Reset the zoom level to the default.