
The Build Interface
The Build Interface is where you'll spend most of your time creating nodes, building graphs, and transforming your data.

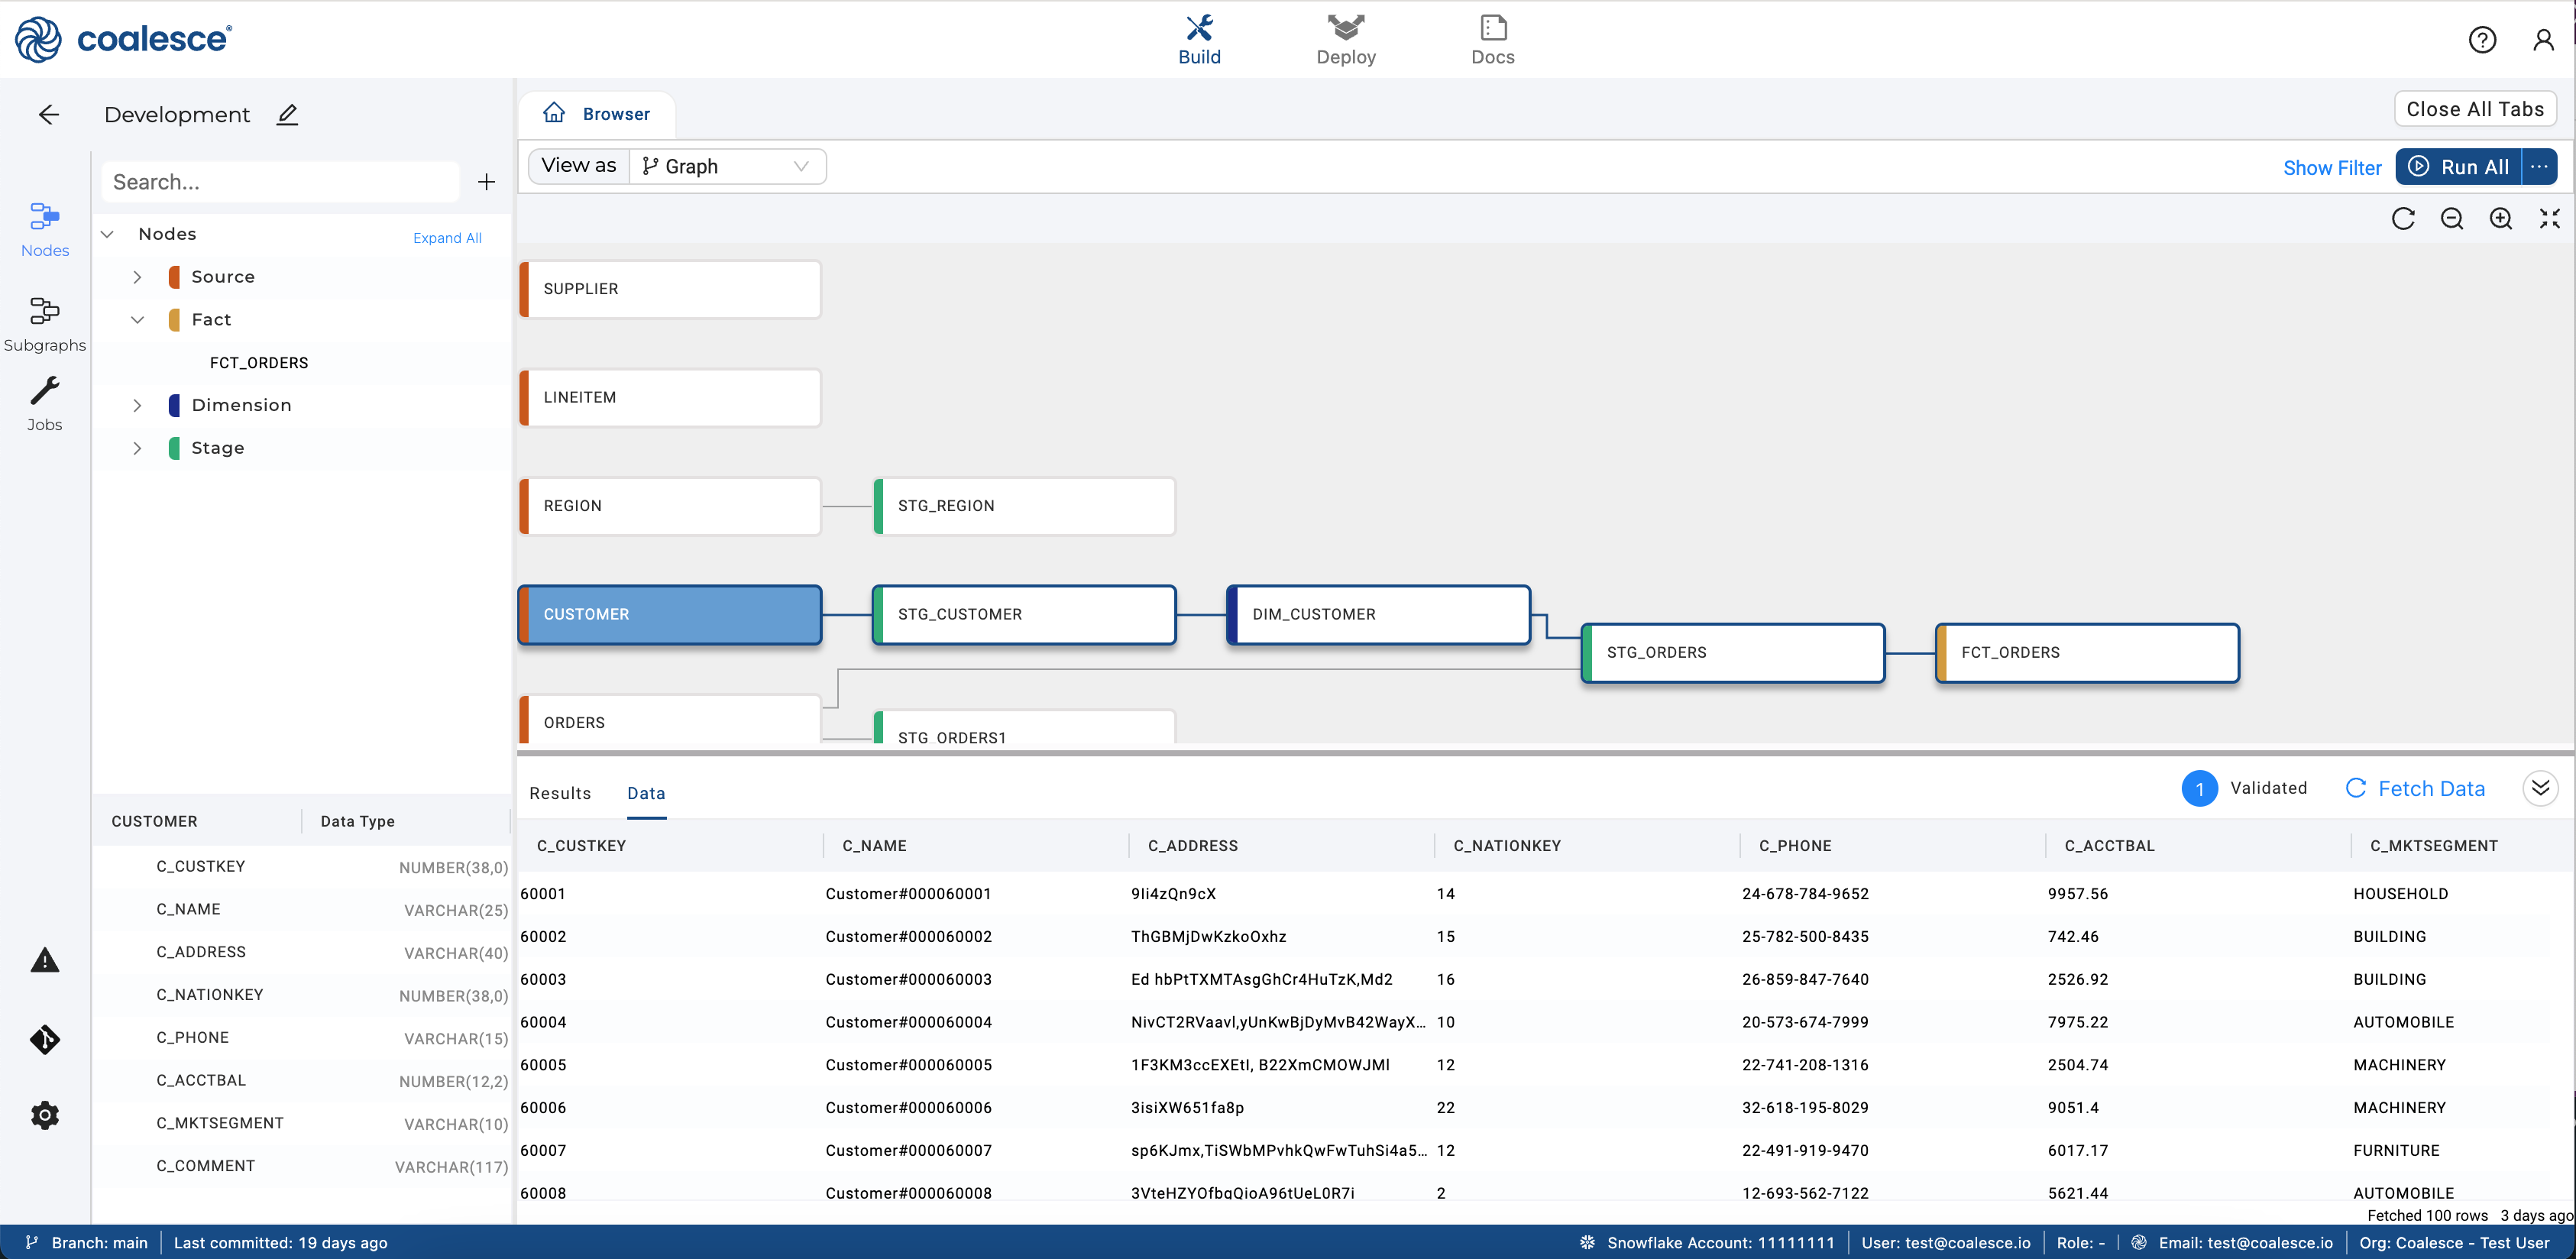
The Build Interface
Build Interface Sidebar
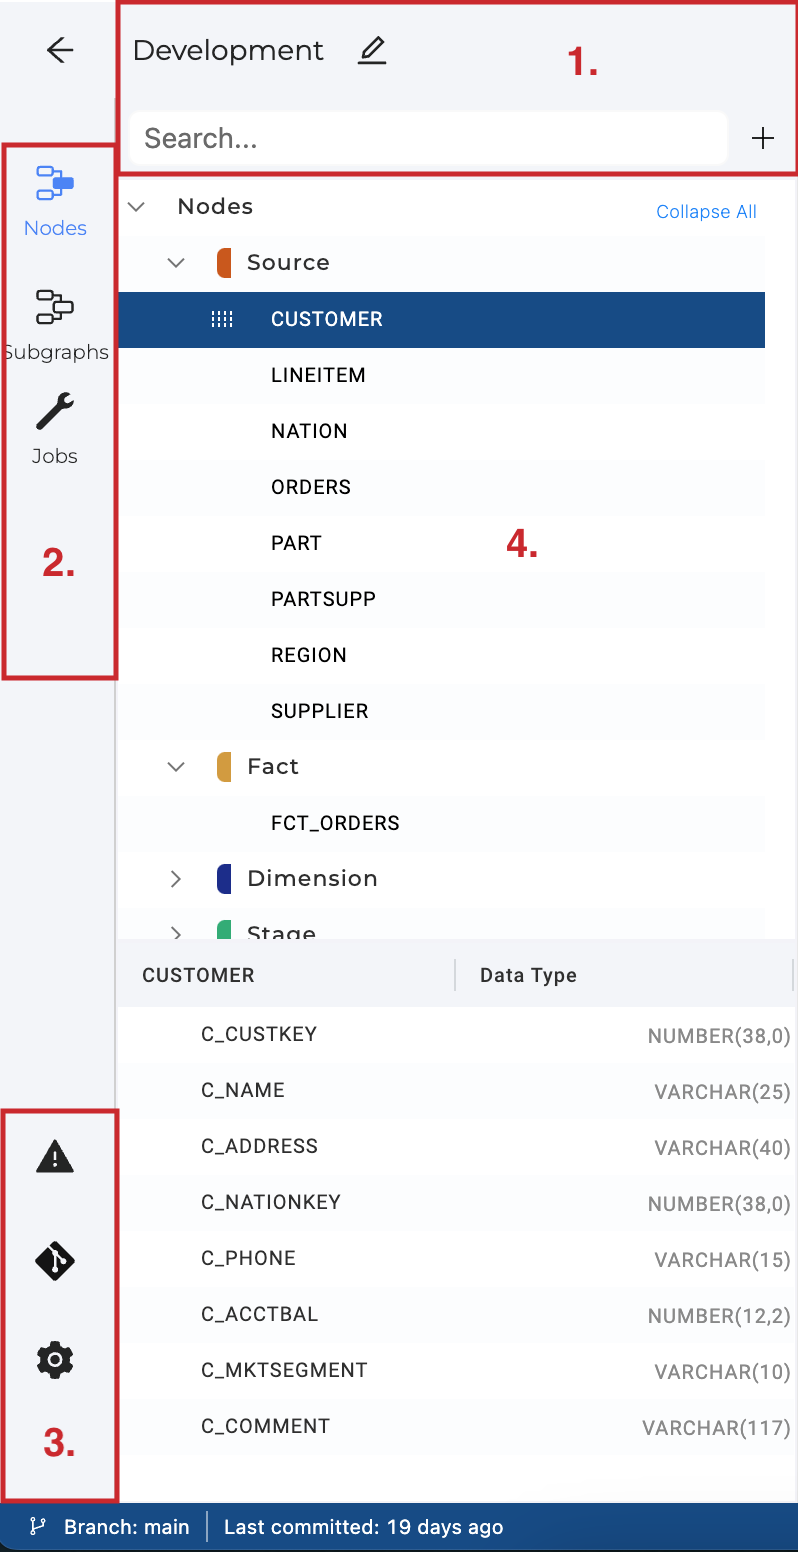
- Workspace name - The name of the workspace you're working in.
- Search bar - Search the node name.
- Click the plus sign to Add Sources(data) or Create a New Node(add an existing node type to the DAG).
- Categories - Change the category to:
- Nodes, the default
- Subgraphs
- Jobs
- Other Options
- The Problem Scanner - List problems with the current workspace.
- Git - Shows working branch, commits, and code differences.
- Build Settings - Opens a tab with the Build Settings.
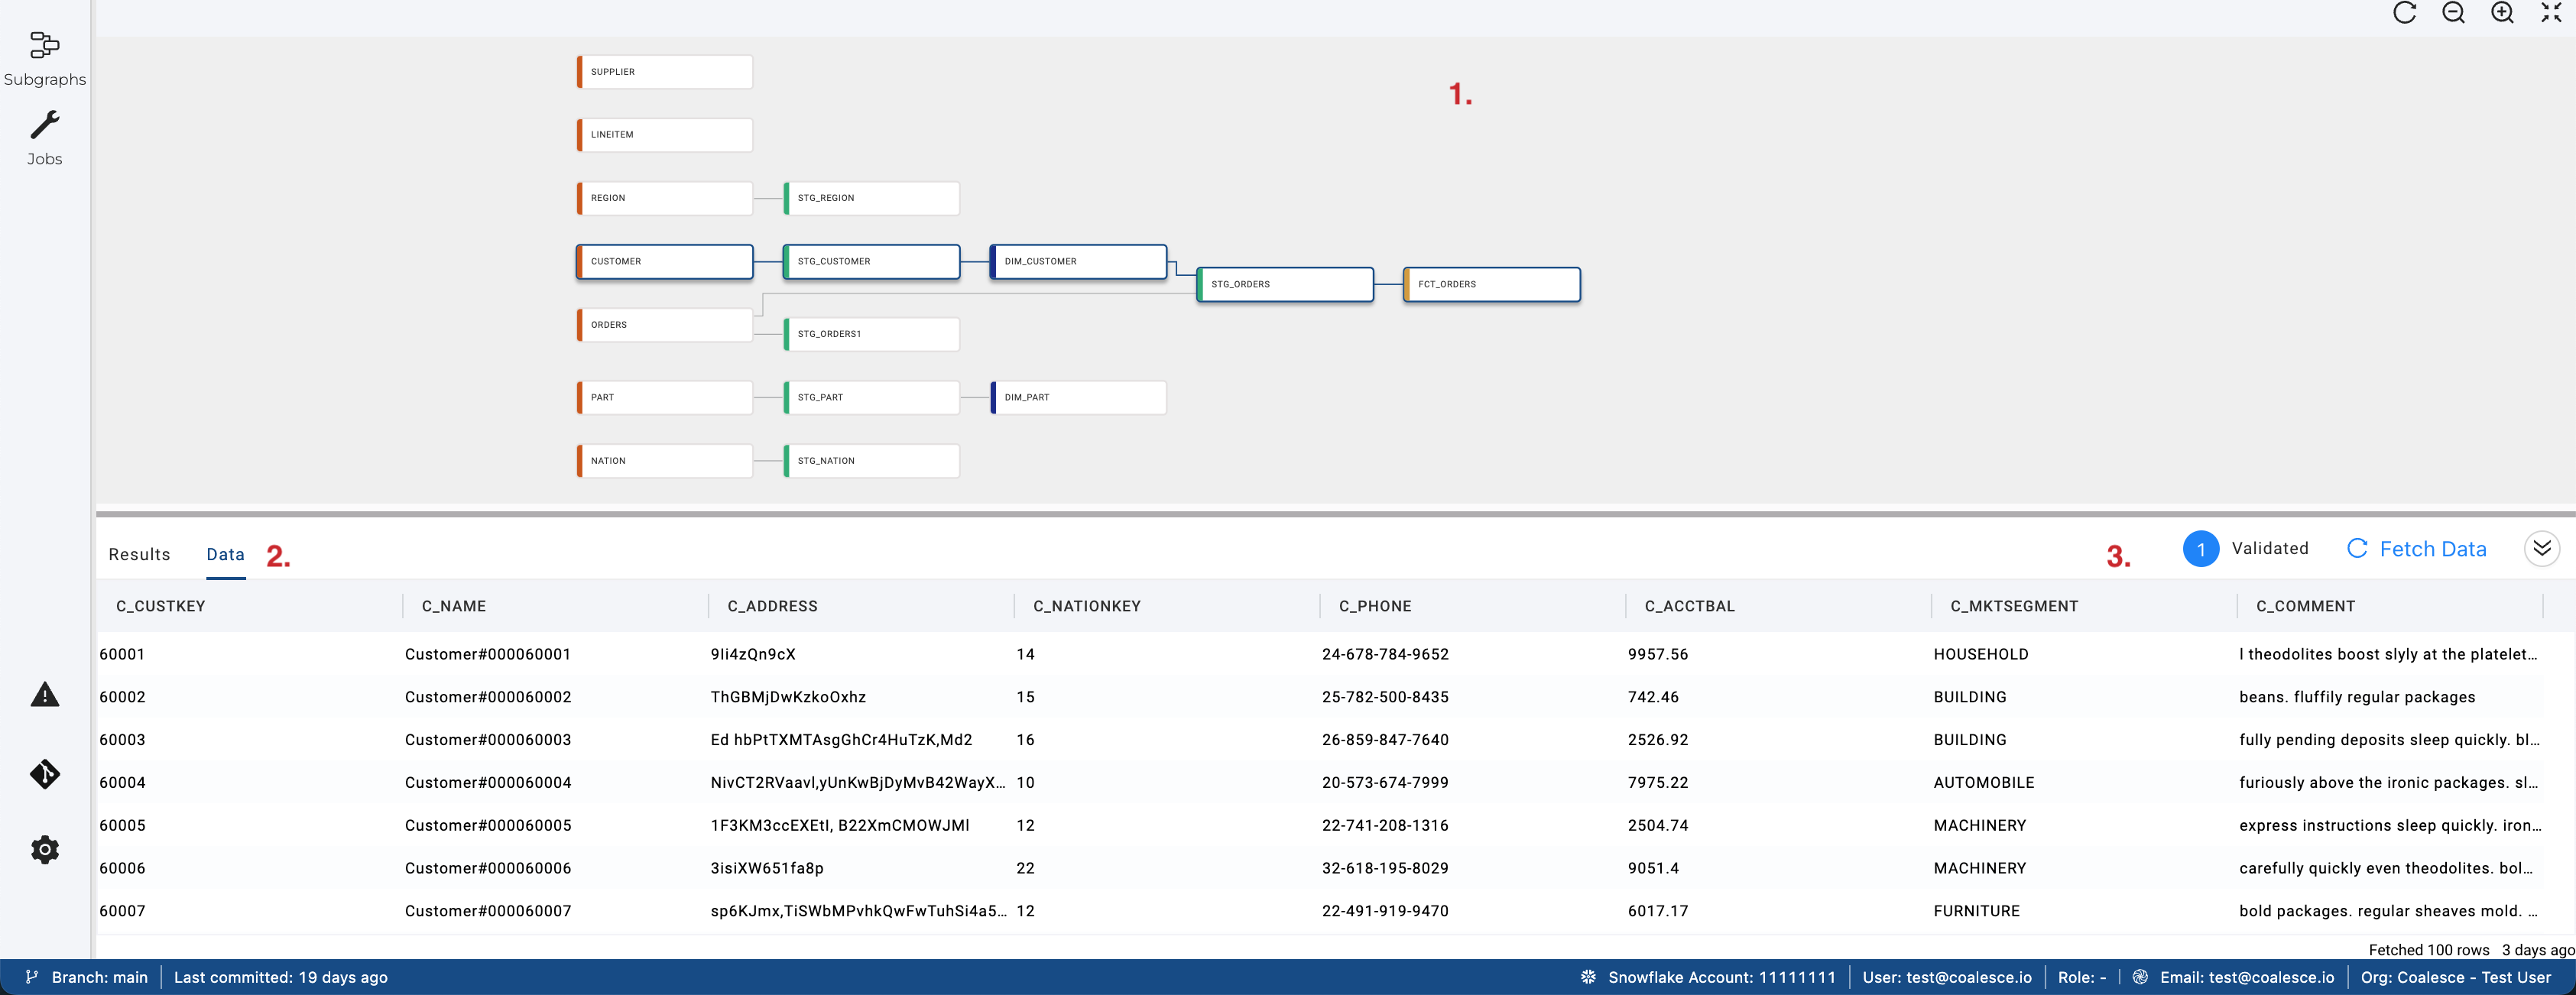
Browser

- Tabs - Any nodes you have open and and the Node Browser will be visible here.
- Search - The filter that enables Selector syntax to be used.
- View as - Change the way you view the Node Graph.
- Graph
- Node Grid
- Column Grid
- Zoom in and out on the Node Graph.
- Run All nodes. You can also:
- Validate all nodes
- Create all nodes
- Validate create all nodes
DAG (Node Graph)
A graph represents a SQL pipeline. Each node is a logical representation and can be materialized as a table or a view in the database. Currently, you can add the following out-of-the-box types of nodes: Source, Stage, Persistent Stage, Dimension, and Fact. You can also create their own Node Types. Learn more in Directed Acyclic Graph (DAG).
- DAG (Node Graph) - See all the nodes you are working on.
- You can also see Subgraphs from here.
- Results and Data Pane - This section provides the user with feedback as to exactly what SQL was queried and the ability to preview the data results within the application.
- Other Options - See the status of your run. Validated, Created or Data Loaded.
Updated about 1 month ago